
 Yahoo Finance
 A Closer Look At Concho Resources Inc.'s (NYSE:CXO) Uninspiring ROE

While some investors are already well versed in financial metrics (hat tip), this article is for those who would like to learn about Return On Equity (ROE) and why it is important. We'll use ROE to examine Concho Resources Inc. (NYSE:CXO), by way of a worked example.
Over the last twelve months Concho Resources has recorded a ROE of 6.9%. That means that for every $1 worth of shareholders' equity, it generated $0.07 in profit.
View our latest analysis for Concho Resources
How Do I Calculate Return On Equity?
The formula for return on equity is:
Return on Equity = Net Profit (from continuing operations) ÷ Shareholders' Equity
Or for Concho Resources:
6.9% = US$1.3b ÷ US$19b (Based on the trailing twelve months to September 2019.)
It's easy to understand the 'net profit' part of that equation, but 'shareholders' equity' requires further explanation. It is all earnings retained by the company, plus any capital paid in by shareholders. The easiest way to calculate shareholders' equity is to subtract the company's total liabilities from the total assets.
What Does Return On Equity Signify?
ROE measures a company's profitability against the profit it retains, and any outside investments. The 'return' is the yearly profit. A higher profit will lead to a higher ROE. So, all else equal, investors should like a high ROE. That means it can be interesting to compare the ROE of different companies.
Does Concho Resources Have A Good Return On Equity?
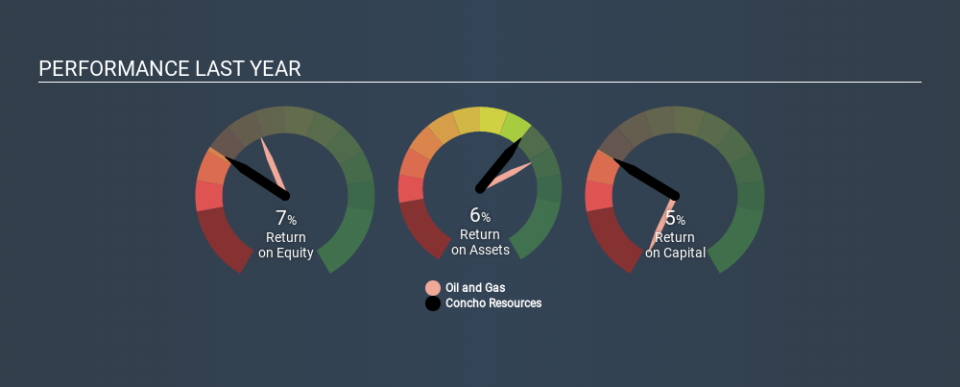
One simple way to determine if a company has a good return on equity is to compare it to the average for its industry. The limitation of this approach is that some companies are quite different from others, even within the same industry classification. As is clear from the image below, Concho Resources has a lower ROE than the average (12%) in the Oil and Gas industry.
Unfortunately, that's sub-optimal. We prefer it when the ROE of a company is above the industry average, but it's not the be-all and end-all if it is lower. Still, shareholders might want to check if insiders have been selling.
Why You Should Consider Debt When Looking At ROE
Companies usually need to invest money to grow their profits. That cash can come from issuing shares, retained earnings, or debt. In the first and second cases, the ROE will reflect this use of cash for investment in the business. In the latter case, the debt used for growth will improve returns, but won't affect the total equity. In this manner the use of debt will boost ROE, even though the core economics of the business stay the same.
Combining Concho Resources's Debt And Its 6.9% Return On Equity
Although Concho Resources does use debt, its debt to equity ratio of 0.24 is still low. Its ROE isn't particularly impressive, but the debt levels are quite modest, so the business probably has some real potential. Careful use of debt to boost returns is often very good for shareholders. However, it could reduce the company's ability to take advantage of future opportunities.
The Key Takeaway
Return on equity is useful for comparing the quality of different businesses. In my book the highest quality companies have high return on equity, despite low debt. All else being equal, a higher ROE is better.
Having said that, while ROE is a useful indicator of business quality, you'll have to look at a whole range of factors to determine the right price to buy a stock. It is important to consider other factors, such as future profit growth -- and how much investment is required going forward. So you might want to check this FREE visualization of analyst forecasts for the company.
Of course, you might find a fantastic investment by looking elsewhere. So take a peek at this free list of interesting companies.
If you spot an error that warrants correction, please contact the editor at editorial-team@simplywallst.com. This article by Simply Wall St is general in nature. It does not constitute a recommendation to buy or sell any stock, and does not take account of your objectives, or your financial situation. Simply Wall St has no position in the stocks mentioned.
We aim to bring you long-term focused research analysis driven by fundamental data. Note that our analysis may not factor in the latest price-sensitive company announcements or qualitative material. Thank you for reading.
