
 Yahoo Finance
 ClearView Wealth Limited (ASX:CVW) Is Going Strong But Fundamentals Appear To Be Mixed : Is There A Clear Direction For The Stock?
Most readers would already be aware that ClearView Wealth's (ASX:CVW) stock increased significantly by 5.2% over the past month. However, we decided to pay attention to the company's fundamentals which don't appear to give a clear sign about the company's financial health. Specifically, we decided to study ClearView Wealth's ROE in this article.
ROE or return on equity is a useful tool to assess how effectively a company can generate returns on the investment it received from its shareholders. In short, ROE shows the profit each dollar generates with respect to its shareholder investments.
Check out our latest analysis for ClearView Wealth
How Is ROE Calculated?
The formula for return on equity is:
Return on Equity = Net Profit (from continuing operations) ÷ Shareholders' Equity
So, based on the above formula, the ROE for ClearView Wealth is:
6.0% = AU$22m ÷ AU$370m (Based on the trailing twelve months to December 2023).
The 'return' is the profit over the last twelve months. One way to conceptualize this is that for each A$1 of shareholders' capital it has, the company made A$0.06 in profit.
What Is The Relationship Between ROE And Earnings Growth?
We have already established that ROE serves as an efficient profit-generating gauge for a company's future earnings. Depending on how much of these profits the company reinvests or "retains", and how effectively it does so, we are then able to assess a company’s earnings growth potential. Assuming everything else remains unchanged, the higher the ROE and profit retention, the higher the growth rate of a company compared to companies that don't necessarily bear these characteristics.
ClearView Wealth's Earnings Growth And 6.0% ROE
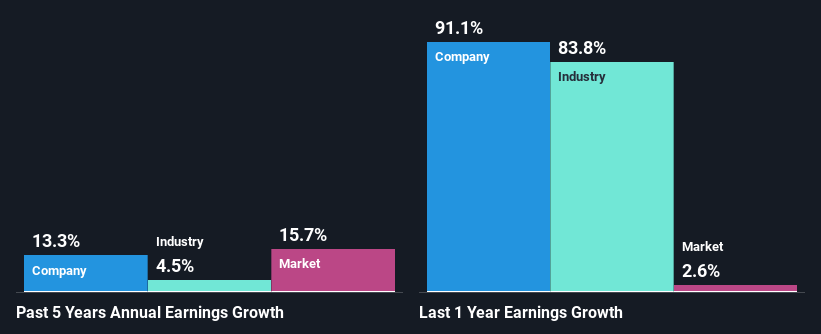
At first glance, ClearView Wealth's ROE doesn't look very promising. Next, when compared to the average industry ROE of 10%, the company's ROE leaves us feeling even less enthusiastic. ClearView Wealth was still able to see a decent net income growth of 13% over the past five years. So, there might be other aspects that are positively influencing the company's earnings growth. For instance, the company has a low payout ratio or is being managed efficiently.
As a next step, we compared ClearView Wealth's net income growth with the industry, and pleasingly, we found that the growth seen by the company is higher than the average industry growth of 4.5%.
Earnings growth is an important metric to consider when valuing a stock. It’s important for an investor to know whether the market has priced in the company's expected earnings growth (or decline). By doing so, they will have an idea if the stock is headed into clear blue waters or if swampy waters await. If you're wondering about ClearView Wealth's's valuation, check out this gauge of its price-to-earnings ratio, as compared to its industry.
Is ClearView Wealth Efficiently Re-investing Its Profits?
The really high three-year median payout ratio of 111% for ClearView Wealth suggests that the company is paying its shareholders more than what it is earning. In spite of this, the company was able to grow its earnings respectably, as we saw above. That being said, the high payout ratio could be worth keeping an eye on in case the company is unable to keep up its current growth momentum. To know the 2 risks we have identified for ClearView Wealth visit our risks dashboard for free.
Moreover, ClearView Wealth is determined to keep sharing its profits with shareholders which we infer from its long history of paying a dividend for at least ten years.
Summary
In total, we're a bit ambivalent about ClearView Wealth's performance. While no doubt its earnings growth is pretty substantial, its ROE and earnings retention is quite poor. So while the company has managed to grow its earnings in spite of this, we are unconvinced if this growth could extend, especially during troubled times. Until now, we have only just grazed the surface of the company's past performance by looking at the company's fundamentals. To gain further insights into ClearView Wealth's past profit growth, check out this visualization of past earnings, revenue and cash flows.
Have feedback on this article? Concerned about the content? Get in touch with us directly. Alternatively, email editorial-team (at) simplywallst.com.
This article by Simply Wall St is general in nature. We provide commentary based on historical data and analyst forecasts only using an unbiased methodology and our articles are not intended to be financial advice. It does not constitute a recommendation to buy or sell any stock, and does not take account of your objectives, or your financial situation. We aim to bring you long-term focused analysis driven by fundamental data. Note that our analysis may not factor in the latest price-sensitive company announcements or qualitative material. Simply Wall St has no position in any stocks mentioned.
