
 Yahoo Finance
 Is Civmec (SGX:P9D) A Risky Investment?

Warren Buffett famously said, 'Volatility is far from synonymous with risk.' It's only natural to consider a company's balance sheet when you examine how risky it is, since debt is often involved when a business collapses. We can see that Civmec Limited (SGX:P9D) does use debt in its business. But the real question is whether this debt is making the company risky.
Why Does Debt Bring Risk?
Debt assists a business until the business has trouble paying it off, either with new capital or with free cash flow. Part and parcel of capitalism is the process of 'creative destruction' where failed businesses are mercilessly liquidated by their bankers. While that is not too common, we often do see indebted companies permanently diluting shareholders because lenders force them to raise capital at a distressed price. Of course, plenty of companies use debt to fund growth, without any negative consequences. The first step when considering a company's debt levels is to consider its cash and debt together.
View our latest analysis for Civmec
What Is Civmec's Net Debt?
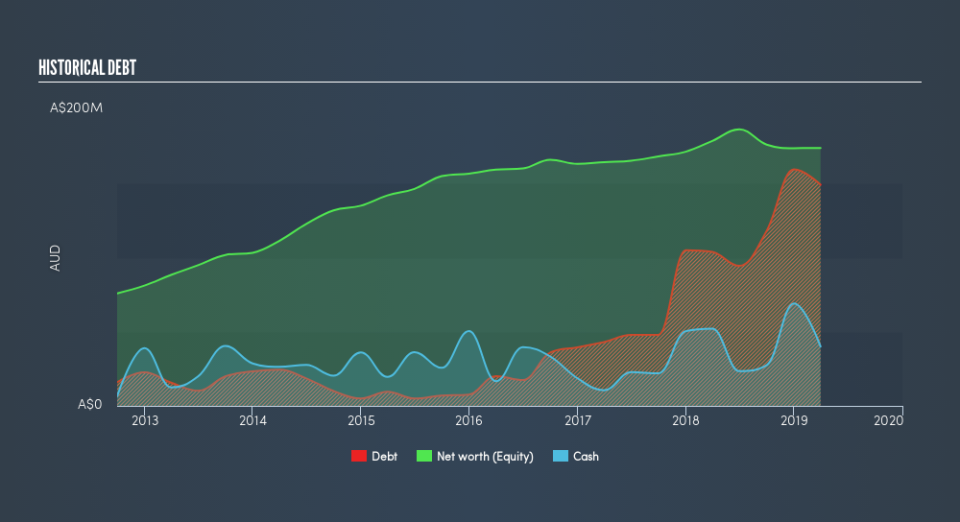
The image below, which you can click on for greater detail, shows that at March 2019 Civmec had debt of AU$135.3m, up from AU$103.8m in one year. However, because it has a cash reserve of AU$40.1m, its net debt is less, at about AU$95.2m.
A Look At Civmec's Liabilities
We can see from the most recent balance sheet that Civmec had liabilities of AU$149.5m falling due within a year, and liabilities of AU$130.2m due beyond that. Offsetting this, it had AU$40.1m in cash and AU$224.5m in receivables that were due within 12 months. So it has liabilities totalling AU$15.2m more than its cash and near-term receivables, combined.
Of course, Civmec has a market capitalization of AU$176.1m, so these liabilities are probably manageable. However, we do think it is worth keeping an eye on its balance sheet strength, as it may change over time.
We use two main ratios to inform us about debt levels relative to earnings. The first is net debt divided by earnings before interest, tax, depreciation, and amortization (EBITDA), while the second is how many times its earnings before interest and tax (EBIT) covers its interest expense (or its interest cover, for short). The advantage of this approach is that we take into account both the absolute quantum of debt (with net debt to EBITDA) and the actual interest expenses associated with that debt (with its interest cover ratio).
Civmec's debt is 2.7 times its EBITDA, and its EBIT cover its interest expense 5.2 times over. This suggests that while the debt levels are significant, we'd stop short of calling them problematic. It is well worth noting that Civmec's EBIT shot up like bamboo after rain, gaining 60% in the last twelve months. That'll make it easier to manage its debt. There's no doubt that we learn most about debt from the balance sheet. But you can't view debt in total isolation; since Civmec will need earnings to service that debt. So if you're keen to discover more about its earnings, it might be worth checking out this graph of its long term earnings trend.
Finally, a company can only pay off debt with cold hard cash, not accounting profits. So the logical step is to look at the proportion of that EBIT that is matched by actual free cash flow. During the last three years, Civmec burned a lot of cash. While that may be a result of expenditure for growth, it does make the debt far more risky.
Our View
Based on what we've seen Civmec is not finding it easy conversion of EBIT to free cash flow, but the other factors we considered give us cause to be optimistic. In particular, we are dazzled with its EBIT growth rate. Looking at all this data makes us feel a little cautious about Civmec's debt levels. While we appreciate debt can enhance returns on equity, we'd suggest that shareholders keep close watch on its debt levels, lest they increase. Above most other metrics, we think its important to track how fast earnings per share is growing, if at all. If you've also come to that realization, you're in luck, because today you can view this interactive graph of Civmec's earnings per share history for free.
If, after all that, you're more interested in a fast growing company with a rock-solid balance sheet, then check out our list of net cash growth stocks without delay.
We aim to bring you long-term focused research analysis driven by fundamental data. Note that our analysis may not factor in the latest price-sensitive company announcements or qualitative material.
If you spot an error that warrants correction, please contact the editor at editorial-team@simplywallst.com. This article by Simply Wall St is general in nature. It does not constitute a recommendation to buy or sell any stock, and does not take account of your objectives, or your financial situation. Simply Wall St has no position in the stocks mentioned. Thank you for reading.
