
 Yahoo Finance
 Update: Chubb (NYSE:CB) Stock Gained 42% In The Last Five Years
If you buy and hold a stock for many years, you'd hope to be making a profit. Furthermore, you'd generally like to see the share price rise faster than the market Unfortunately for shareholders, while the Chubb Limited (NYSE:CB) share price is up 42% in the last five years, that's less than the market return. Over the last twelve months the stock price has risen a very respectable 10%.
View our latest analysis for Chubb
While markets are a powerful pricing mechanism, share prices reflect investor sentiment, not just underlying business performance. One way to examine how market sentiment has changed over time is to look at the interaction between a company's share price and its earnings per share (EPS).
During five years of share price growth, Chubb actually saw its EPS drop 2.1% per year.
By glancing at these numbers, we'd posit that the decline in earnings per share is not representative of how the business has changed over the years. Since the change in EPS doesn't seem to correlate with the change in share price, it's worth taking a look at other metrics.
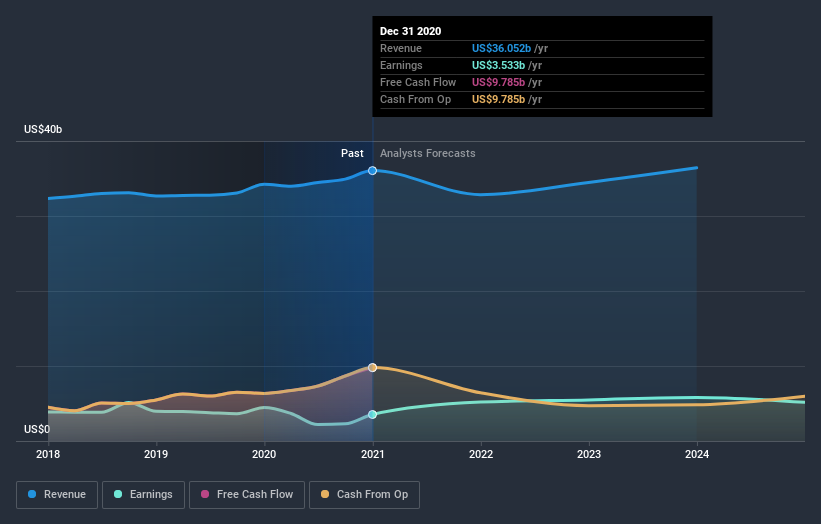
We doubt the modest 1.9% dividend yield is attracting many buyers to the stock. In contrast revenue growth of 7.3% per year is probably viewed as evidence that Chubb is growing, a real positive. It's quite possible that management are prioritizing revenue growth over EPS growth at the moment.
You can see below how earnings and revenue have changed over time (discover the exact values by clicking on the image).
We like that insiders have been buying shares in the last twelve months. Even so, future earnings will be far more important to whether current shareholders make money. You can see what analysts are predicting for Chubb in this interactive graph of future profit estimates.
What About Dividends?
As well as measuring the share price return, investors should also consider the total shareholder return (TSR). The TSR is a return calculation that accounts for the value of cash dividends (assuming that any dividend received was reinvested) and the calculated value of any discounted capital raisings and spin-offs. It's fair to say that the TSR gives a more complete picture for stocks that pay a dividend. We note that for Chubb the TSR over the last 5 years was 59%, which is better than the share price return mentioned above. This is largely a result of its dividend payments!
A Different Perspective
Chubb provided a TSR of 13% over the last twelve months. But that return falls short of the market. On the bright side, that's still a gain, and it's actually better than the average return of 10% over half a decade This suggests the company might be improving over time. It's always interesting to track share price performance over the longer term. But to understand Chubb better, we need to consider many other factors. Consider for instance, the ever-present spectre of investment risk. We've identified 1 warning sign with Chubb , and understanding them should be part of your investment process.
Chubb is not the only stock insiders are buying. So take a peek at this free list of growing companies with insider buying.
Please note, the market returns quoted in this article reflect the market weighted average returns of stocks that currently trade on US exchanges.
This article by Simply Wall St is general in nature. It does not constitute a recommendation to buy or sell any stock, and does not take account of your objectives, or your financial situation. We aim to bring you long-term focused analysis driven by fundamental data. Note that our analysis may not factor in the latest price-sensitive company announcements or qualitative material. Simply Wall St has no position in any stocks mentioned.
Have feedback on this article? Concerned about the content? Get in touch with us directly. Alternatively, email editorial-team (at) simplywallst.com.
