
 Yahoo Finance
 What Is Cheniere Energy's (NYSEMKT:LNG) P/E Ratio After Its Share Price Tanked?

To the annoyance of some shareholders, Cheniere Energy (NYSEMKT:LNG) shares are down a considerable 34% in the last month. Indeed the recent decline has arguably caused some bitterness for shareholders who have held through the 46% drop over twelve months.
All else being equal, a share price drop should make a stock more attractive to potential investors. While the market sentiment towards a stock is very changeable, in the long run, the share price will tend to move in the same direction as earnings per share. The implication here is that long term investors have an opportunity when expectations of a company are too low. Perhaps the simplest way to get a read on investors' expectations of a business is to look at its Price to Earnings Ratio (PE Ratio). Investors have optimistic expectations of companies with higher P/E ratios, compared to companies with lower P/E ratios.
See our latest analysis for Cheniere Energy
How Does Cheniere Energy's P/E Ratio Compare To Its Peers?
Cheniere Energy's P/E of 14.74 indicates some degree of optimism towards the stock. The image below shows that Cheniere Energy has a higher P/E than the average (7.5) P/E for companies in the oil and gas industry.
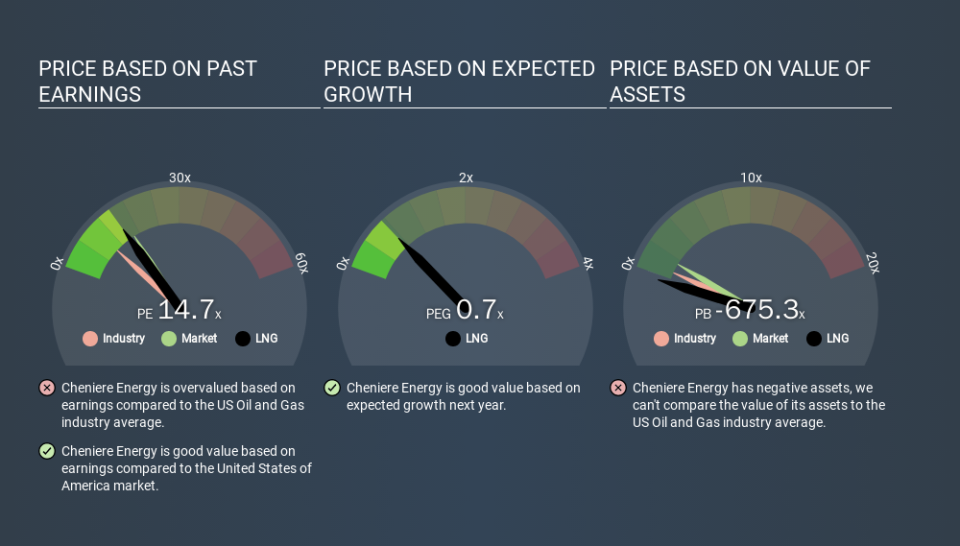
Cheniere Energy's P/E tells us that market participants think the company will perform better than its industry peers, going forward. Clearly the market expects growth, but it isn't guaranteed. So further research is always essential. I often monitor director buying and selling.
How Growth Rates Impact P/E Ratios
Probably the most important factor in determining what P/E a company trades on is the earnings growth. Earnings growth means that in the future the 'E' will be higher. That means even if the current P/E is high, it will reduce over time if the share price stays flat. So while a stock may look expensive based on past earnings, it could be cheap based on future earnings.
It's nice to see that Cheniere Energy grew EPS by a stonking 32% in the last year.
Remember: P/E Ratios Don't Consider The Balance Sheet
The 'Price' in P/E reflects the market capitalization of the company. That means it doesn't take debt or cash into account. The exact same company would hypothetically deserve a higher P/E ratio if it had a strong balance sheet, than if it had a weak one with lots of debt, because a cashed up company can spend on growth.
Such expenditure might be good or bad, in the long term, but the point here is that the balance sheet is not reflected by this ratio.
How Does Cheniere Energy's Debt Impact Its P/E Ratio?
Net debt totals a substantial 297% of Cheniere Energy's market cap. This is a relatively high level of debt, so the stock probably deserves a relatively low P/E ratio. Keep that in mind when comparing it to other companies.
The Verdict On Cheniere Energy's P/E Ratio
Cheniere Energy trades on a P/E ratio of 14.7, which is fairly close to the US market average of 15.1. It does have enough debt to add risk, although earnings growth was strong in the last year. The P/E suggests that the market is not convinced EPS will continue to improve strongly. Given Cheniere Energy's P/E ratio has declined from 22.5 to 14.7 in the last month, we know for sure that the market is significantly less confident about the business today, than it was back then. For those who prefer to invest with the flow of momentum, that might be a bad sign, but for a contrarian, it may signal opportunity.
Investors have an opportunity when market expectations about a stock are wrong. If the reality for a company is not as bad as the P/E ratio indicates, then the share price should increase as the market realizes this. So this free report on the analyst consensus forecasts could help you make a master move on this stock.
Of course you might be able to find a better stock than Cheniere Energy. So you may wish to see this free collection of other companies that have grown earnings strongly.
If you spot an error that warrants correction, please contact the editor at editorial-team@simplywallst.com. This article by Simply Wall St is general in nature. It does not constitute a recommendation to buy or sell any stock, and does not take account of your objectives, or your financial situation. Simply Wall St has no position in the stocks mentioned.
We aim to bring you long-term focused research analysis driven by fundamental data. Note that our analysis may not factor in the latest price-sensitive company announcements or qualitative material. Thank you for reading.
