
 Yahoo Finance
 Cheniere Energy, Inc.’s (NYSEMKT:LNG) Investment Returns Are Lagging Its Industry

Today we are going to look at Cheniere Energy, Inc. (NYSEMKT:LNG) to see whether it might be an attractive investment prospect. To be precise, we'll consider its Return On Capital Employed (ROCE), as that will inform our view of the quality of the business.
First, we'll go over how we calculate ROCE. Next, we'll compare it to others in its industry. Finally, we'll look at how its current liabilities affect its ROCE.
Understanding Return On Capital Employed (ROCE)
ROCE measures the 'return' (pre-tax profit) a company generates from capital employed in its business. Generally speaking a higher ROCE is better. Ultimately, it is a useful but imperfect metric. Renowned investment researcher Michael Mauboussin has suggested that a high ROCE can indicate that 'one dollar invested in the company generates value of more than one dollar'.
So, How Do We Calculate ROCE?
The formula for calculating the return on capital employed is:
Return on Capital Employed = Earnings Before Interest and Tax (EBIT) ÷ (Total Assets - Current Liabilities)
Or for Cheniere Energy:
0.061 = US$2.0b ÷ (US$35b - US$2.2b) (Based on the trailing twelve months to June 2019.)
Therefore, Cheniere Energy has an ROCE of 6.1%.
View our latest analysis for Cheniere Energy
Is Cheniere Energy's ROCE Good?
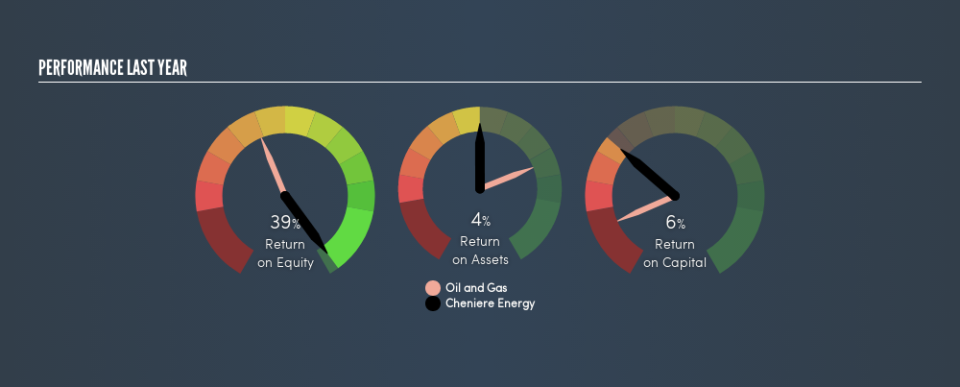
When making comparisons between similar businesses, investors may find ROCE useful. Using our data, Cheniere Energy's ROCE appears to be significantly below the 7.9% average in the Oil and Gas industry. This could be seen as a negative, as it suggests some competitors may be employing their capital more efficiently. Separate from how Cheniere Energy stacks up against its industry, its ROCE in absolute terms is mediocre; relative to the returns on government bonds. Investors may wish to consider higher-performing investments.
Cheniere Energy has an ROCE of 6.1%, but it didn't have an ROCE 3 years ago, since it was unprofitable. This makes us wonder if the company is improving. The image below shows how Cheniere Energy's ROCE compares to its industry, and you can click it to see more detail on its past growth.
Remember that this metric is backwards looking - it shows what has happened in the past, and does not accurately predict the future. ROCE can be deceptive for cyclical businesses, as returns can look incredible in boom times, and terribly low in downturns. This is because ROCE only looks at one year, instead of considering returns across a whole cycle. Remember that most companies like Cheniere Energy are cyclical businesses. Since the future is so important for investors, you should check out our free report on analyst forecasts for Cheniere Energy.
Do Cheniere Energy's Current Liabilities Skew Its ROCE?
Liabilities, such as supplier bills and bank overdrafts, are referred to as current liabilities if they need to be paid within 12 months. The ROCE equation subtracts current liabilities from capital employed, so a company with a lot of current liabilities appears to have less capital employed, and a higher ROCE than otherwise. To counter this, investors can check if a company has high current liabilities relative to total assets.
Cheniere Energy has total assets of US$35b and current liabilities of US$2.2b. As a result, its current liabilities are equal to approximately 6.4% of its total assets. Cheniere Energy has a low level of current liabilities, which have a minimal impact on its uninspiring ROCE.
The Bottom Line On Cheniere Energy's ROCE
If performance improves, then Cheniere Energy may be an OK investment, especially at the right valuation. But note: make sure you look for a great company, not just the first idea you come across. So take a peek at this free list of interesting companies with strong recent earnings growth (and a P/E ratio below 20).
If you are like me, then you will not want to miss this free list of growing companies that insiders are buying.
We aim to bring you long-term focused research analysis driven by fundamental data. Note that our analysis may not factor in the latest price-sensitive company announcements or qualitative material.
If you spot an error that warrants correction, please contact the editor at editorial-team@simplywallst.com. This article by Simply Wall St is general in nature. It does not constitute a recommendation to buy or sell any stock, and does not take account of your objectives, or your financial situation. Simply Wall St has no position in the stocks mentioned. Thank you for reading.
