
 Yahoo Finance
 What Is Check Point Software Technologies's (NASDAQ:CHKP) P/E Ratio After Its Share Price Tanked?

To the annoyance of some shareholders, Check Point Software Technologies (NASDAQ:CHKP) shares are down a considerable 31% in the last month. That drop has capped off a tough year for shareholders, with the share price down 34% in that time.
Assuming nothing else has changed, a lower share price makes a stock more attractive to potential buyers. In the long term, share prices tend to follow earnings per share, but in the short term prices bounce around in response to short term factors (which are not always obvious). The implication here is that long term investors have an opportunity when expectations of a company are too low. One way to gauge market expectations of a stock is to look at its Price to Earnings Ratio (PE Ratio). Investors have optimistic expectations of companies with higher P/E ratios, compared to companies with lower P/E ratios.
View our latest analysis for Check Point Software Technologies
Does Check Point Software Technologies Have A Relatively High Or Low P/E For Its Industry?
We can tell from its P/E ratio of 15.06 that sentiment around Check Point Software Technologies isn't particularly high. If you look at the image below, you can see Check Point Software Technologies has a lower P/E than the average (37.1) in the software industry classification.
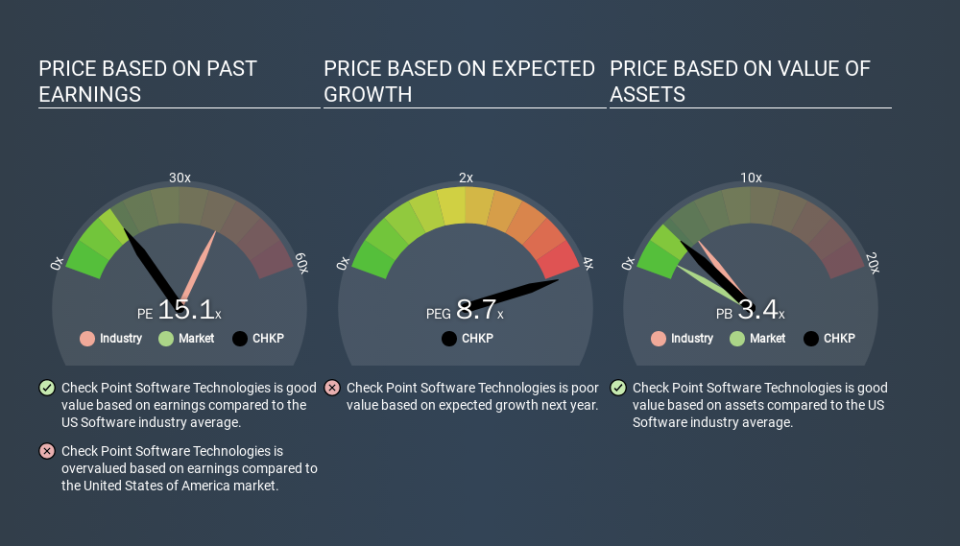
Check Point Software Technologies's P/E tells us that market participants think it will not fare as well as its peers in the same industry. Since the market seems unimpressed with Check Point Software Technologies, it's quite possible it could surprise on the upside. It is arguably worth checking if insiders are buying shares, because that might imply they believe the stock is undervalued.
How Growth Rates Impact P/E Ratios
Earnings growth rates have a big influence on P/E ratios. If earnings are growing quickly, then the 'E' in the equation will increase faster than it would otherwise. Therefore, even if you pay a high multiple of earnings now, that multiple will become lower in the future. So while a stock may look expensive based on past earnings, it could be cheap based on future earnings.
Check Point Software Technologies increased earnings per share by 4.6% last year. And its annual EPS growth rate over 5 years is 9.4%.
A Limitation: P/E Ratios Ignore Debt and Cash In The Bank
One drawback of using a P/E ratio is that it considers market capitalization, but not the balance sheet. That means it doesn't take debt or cash into account. Theoretically, a business can improve its earnings (and produce a lower P/E in the future) by investing in growth. That means taking on debt (or spending its cash).
While growth expenditure doesn't always pay off, the point is that it is a good option to have; but one that the P/E ratio ignores.
So What Does Check Point Software Technologies's Balance Sheet Tell Us?
With net cash of US$1.6b, Check Point Software Technologies has a very strong balance sheet, which may be important for its business. Having said that, at 12% of its market capitalization the cash hoard would contribute towards a higher P/E ratio.
The Bottom Line On Check Point Software Technologies's P/E Ratio
Check Point Software Technologies's P/E is 15.1 which is above average (13.3) in its market. EPS was up modestly better over the last twelve months. And the healthy balance sheet means the company can sustain growth while the P/E suggests shareholders think it will. What can be absolutely certain is that the market has become significantly less optimistic about Check Point Software Technologies over the last month, with the P/E ratio falling from 21.8 back then to 15.1 today. For those who don't like to trade against momentum, that could be a warning sign, but a contrarian investor might want to take a closer look.
Investors have an opportunity when market expectations about a stock are wrong. As value investor Benjamin Graham famously said, 'In the short run, the market is a voting machine but in the long run, it is a weighing machine. So this free visualization of the analyst consensus on future earnings could help you make the right decision about whether to buy, sell, or hold.
Of course, you might find a fantastic investment by looking at a few good candidates. So take a peek at this free list of companies with modest (or no) debt, trading on a P/E below 20.
If you spot an error that warrants correction, please contact the editor at editorial-team@simplywallst.com. This article by Simply Wall St is general in nature. It does not constitute a recommendation to buy or sell any stock, and does not take account of your objectives, or your financial situation. Simply Wall St has no position in the stocks mentioned.
We aim to bring you long-term focused research analysis driven by fundamental data. Note that our analysis may not factor in the latest price-sensitive company announcements or qualitative material. Thank you for reading.
