
 Yahoo Finance
 Is CF Industries Holdings, Inc. (NYSE:CF) An Attractive Dividend Stock?

Is CF Industries Holdings, Inc. (NYSE:CF) a good dividend stock? How can we tell? Dividend paying companies with growing earnings can be highly rewarding in the long term. If you are hoping to live on your dividends, it's important to be more stringent with your investments than the average punter. Regular readers know we like to apply the same approach to each dividend stock, and we hope you'll find our analysis useful.
A slim 2.7% yield is hard to get excited about, but the long payment history is respectable. At the right price, or with strong growth opportunities, CF Industries Holdings could have potential. The company also returned around 6.7% of its market capitalisation to shareholders in the form of stock buybacks over the past year. Before you buy any stock for its dividend however, you should always remember Warren Buffett's two rules: 1) Don't lose money, and 2) Remember rule #1. We'll run through some checks below to help with this.
Explore this interactive chart for our latest analysis on CF Industries Holdings!
Payout ratios
Dividends are typically paid from company earnings. If a company pays more in dividends than it earned, then the dividend might become unsustainable - hardly an ideal situation. So we need to form a view on if a company's dividend is sustainable, relative to its net profit after tax. In the last year, CF Industries Holdings paid out 55% of its profit as dividends. This is a healthy payout ratio, and while it does limit the amount of earnings that can be reinvested in the business, there is also some room to lift the payout ratio over time.
We also measure dividends paid against a company's levered free cash flow, to see if enough cash was generated to cover the dividend. Of the free cash flow it generated last year, CF Industries Holdings paid out 27% as dividends, suggesting the dividend is affordable. It's positive to see that CF Industries Holdings's dividend is covered by both profits and cash flow, since this is generally a sign that the dividend is sustainable, and a lower payout ratio usually suggests a greater margin of safety before the dividend gets cut.
Is CF Industries Holdings's Balance Sheet Risky?
As CF Industries Holdings has a meaningful amount of debt, we need to check its balance sheet to see if the company might have debt risks. A rough way to check this is with these two simple ratios: a) net debt divided by EBITDA (earnings before interest, tax, depreciation and amortisation), and b) net interest cover. Net debt to EBITDA is a measure of a company's total debt. Net interest cover measures the ability to meet interest payments. Essentially we check that a) the company does not have too much debt, and b) that it can afford to pay the interest. With net debt of 2.01 times its EBITDA, CF Industries Holdings's debt burden is within a normal range for most listed companies.
Net interest cover can be calculated by dividing earnings before interest and tax (EBIT) by the company's net interest expense. Interest cover of 4.20 times its interest expense is starting to become a concern for CF Industries Holdings, and be aware that lenders may place additional restrictions on the company as well.
Remember, you can always get a snapshot of CF Industries Holdings's latest financial position, by checking our visualisation of its financial health.
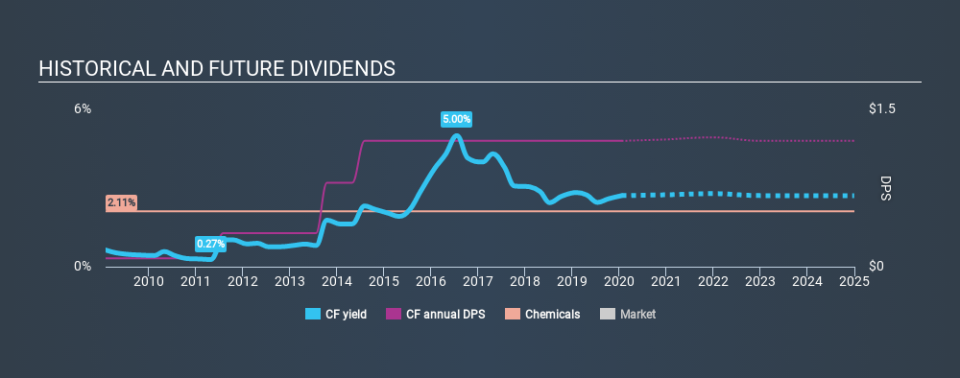
Dividend Volatility
One of the major risks of relying on dividend income, is the potential for a company to struggle financially and cut its dividend. Not only is your income cut, but the value of your investment declines as well - nasty. CF Industries Holdings has been paying dividends for a long time, but for the purpose of this analysis, we only examine the past 10 years of payments. During this period the dividend has been stable, which could imply the business could have relatively consistent earnings power. During the past ten-year period, the first annual payment was US$0.08 in 2010, compared to US$1.20 last year. This works out to be a compound annual growth rate (CAGR) of approximately 31% a year over that time.
Dividends have been growing pretty quickly, and even more impressively, they haven't experienced any notable falls during this period.
Dividend Growth Potential
Dividend payments have been consistent over the past few years, but we should always check if earnings per share (EPS) are growing, as this will help maintain the purchasing power of the dividend. Over the past five years, it looks as though CF Industries Holdings's EPS have declined at around 15% a year. A sharp decline in earnings per share is not great from from a dividend perspective, as even conservative payout ratios can come under pressure if earnings fall far enough.
Conclusion
Dividend investors should always want to know if a) a company's dividends are affordable, b) if there is a track record of consistent payments, and c) if the dividend is capable of growing. First, we think CF Industries Holdings has an acceptable payout ratio and its dividend is well covered by cashflow. It's not great to see earnings per share shrinking. The dividends have been relatively consistent, but we wonder for how much longer this will be true. While we're not hugely bearish on it, overall we think there are potentially better dividend stocks than CF Industries Holdings out there.
Given that earnings are not growing, the dividend does not look nearly so attractive. Businesses can change though, and we think it would make sense to see what analysts are forecasting for the company.
If you are a dividend investor, you might also want to look at our curated list of dividend stocks yielding above 3%.
If you spot an error that warrants correction, please contact the editor at editorial-team@simplywallst.com. This article by Simply Wall St is general in nature. It does not constitute a recommendation to buy or sell any stock, and does not take account of your objectives, or your financial situation. Simply Wall St has no position in the stocks mentioned.
We aim to bring you long-term focused research analysis driven by fundamental data. Note that our analysis may not factor in the latest price-sensitive company announcements or qualitative material. Thank you for reading.
