
 Yahoo Finance
 Centuria Capital Group (ASX:CNI) shareholders have endured a 41% loss from investing in the stock a year ago
Centuria Capital Group (ASX:CNI) shareholders should be happy to see the share price up 23% in the last month. But that doesn't change the fact that the returns over the last year have been less than pleasing. In fact the stock is down 44% in the last year, well below the market return.
Since shareholders are down over the longer term, lets look at the underlying fundamentals over the that time and see if they've been consistent with returns.
Check out our latest analysis for Centuria Capital Group
In his essay The Superinvestors of Graham-and-Doddsville Warren Buffett described how share prices do not always rationally reflect the value of a business. One imperfect but simple way to consider how the market perception of a company has shifted is to compare the change in the earnings per share (EPS) with the share price movement.
Unfortunately Centuria Capital Group reported an EPS drop of 35% for the last year. This reduction in EPS is not as bad as the 44% share price fall. So it seems the market was too confident about the business, a year ago. Of course, with a P/E ratio of 71.40, the market remains optimistic.
You can see below how EPS has changed over time (discover the exact values by clicking on the image).
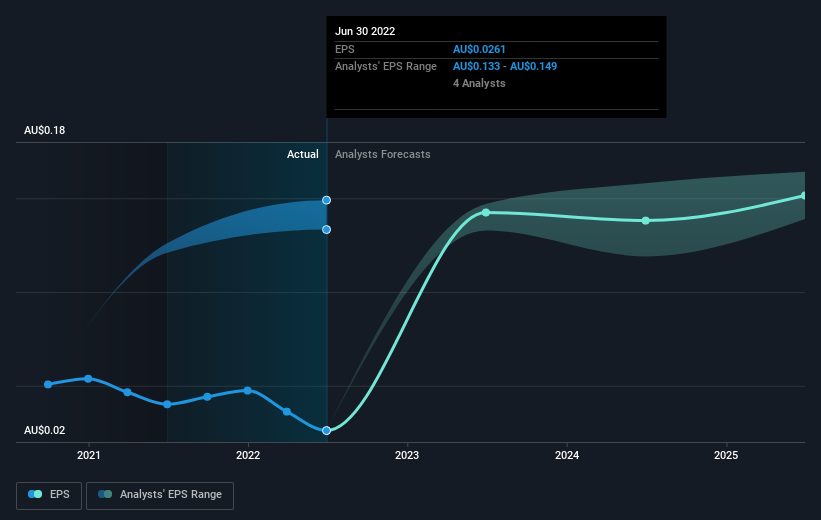
Dive deeper into Centuria Capital Group's key metrics by checking this interactive graph of Centuria Capital Group's earnings, revenue and cash flow.
What About Dividends?
It is important to consider the total shareholder return, as well as the share price return, for any given stock. Whereas the share price return only reflects the change in the share price, the TSR includes the value of dividends (assuming they were reinvested) and the benefit of any discounted capital raising or spin-off. Arguably, the TSR gives a more comprehensive picture of the return generated by a stock. In the case of Centuria Capital Group, it has a TSR of -41% for the last 1 year. That exceeds its share price return that we previously mentioned. The dividends paid by the company have thusly boosted the total shareholder return.
A Different Perspective
We regret to report that Centuria Capital Group shareholders are down 41% for the year (even including dividends). Unfortunately, that's worse than the broader market decline of 0.4%. However, it could simply be that the share price has been impacted by broader market jitters. It might be worth keeping an eye on the fundamentals, in case there's a good opportunity. On the bright side, long term shareholders have made money, with a gain of 12% per year over half a decade. It could be that the recent sell-off is an opportunity, so it may be worth checking the fundamental data for signs of a long term growth trend. While it is well worth considering the different impacts that market conditions can have on the share price, there are other factors that are even more important. Take risks, for example - Centuria Capital Group has 3 warning signs we think you should be aware of.
For those who like to find winning investments this free list of growing companies with recent insider purchasing, could be just the ticket.
Please note, the market returns quoted in this article reflect the market weighted average returns of stocks that currently trade on AU exchanges.
Have feedback on this article? Concerned about the content? Get in touch with us directly. Alternatively, email editorial-team (at) simplywallst.com.
This article by Simply Wall St is general in nature. We provide commentary based on historical data and analyst forecasts only using an unbiased methodology and our articles are not intended to be financial advice. It does not constitute a recommendation to buy or sell any stock, and does not take account of your objectives, or your financial situation. We aim to bring you long-term focused analysis driven by fundamental data. Note that our analysis may not factor in the latest price-sensitive company announcements or qualitative material. Simply Wall St has no position in any stocks mentioned.
Join A Paid User Research Session
You’ll receive a US$30 Amazon Gift card for 1 hour of your time while helping us build better investing tools for the individual investors like yourself. Sign up here
