
 Yahoo Finance
 Centuria Capital Group (ASX:CNI) Has Gifted Shareholders With A Fantastic 126% Total Return On Their Investment

Centuria Capital Group (ASX:CNI) shareholders might understandably be very concerned that the share price has dropped 39% in the last quarter. On the bright side the returns have been quite good over the last half decade. It has returned a market beating 57% in that time.
See our latest analysis for Centuria Capital Group
There is no denying that markets are sometimes efficient, but prices do not always reflect underlying business performance. One flawed but reasonable way to assess how sentiment around a company has changed is to compare the earnings per share (EPS) with the share price.
During five years of share price growth, Centuria Capital Group actually saw its EPS drop 19% per year.
This means it's unlikely the market is judging the company based on earnings growth. Because earnings per share don't seem to match up with the share price, we'll take a look at other metrics instead.
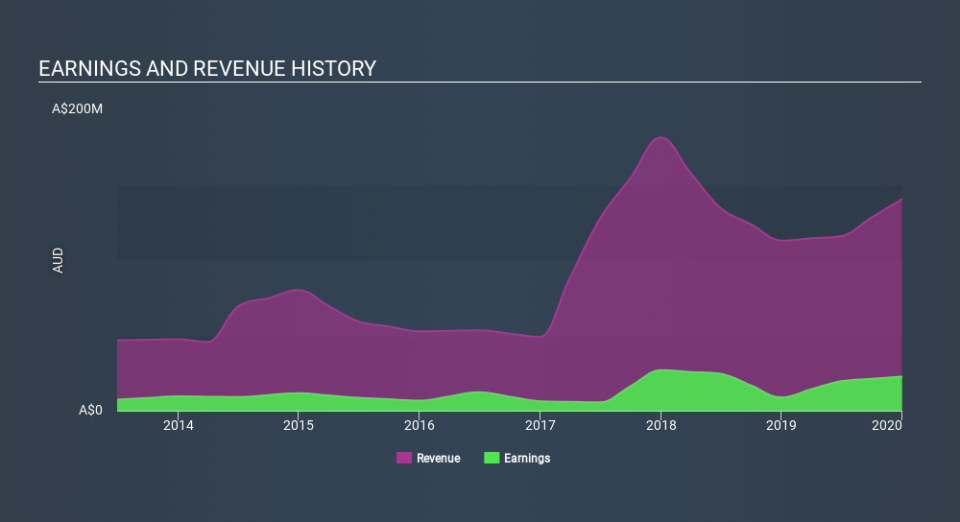
We note that the dividend is higher than it was previously - always nice to see. It could be that the company is reaching maturity and dividend investors are buying for the yield. The revenue growth of about 19% per year might also encourage buyers.
The graphic below depicts how earnings and revenue have changed over time (unveil the exact values by clicking on the image).
We consider it positive that insiders have made significant purchases in the last year. Having said that, most people consider earnings and revenue growth trends to be a more meaningful guide to the business. You can see what analysts are predicting for Centuria Capital Group in this interactive graph of future profit estimates.
What About Dividends?
As well as measuring the share price return, investors should also consider the total shareholder return (TSR). Whereas the share price return only reflects the change in the share price, the TSR includes the value of dividends (assuming they were reinvested) and the benefit of any discounted capital raising or spin-off. Arguably, the TSR gives a more comprehensive picture of the return generated by a stock. As it happens, Centuria Capital Group's TSR for the last 5 years was 126%, which exceeds the share price return mentioned earlier. And there's no prize for guessing that the dividend payments largely explain the divergence!
A Different Perspective
It's nice to see that Centuria Capital Group shareholders have received a total shareholder return of 13% over the last year. And that does include the dividend. Having said that, the five-year TSR of 18% a year, is even better. I find it very interesting to look at share price over the long term as a proxy for business performance. But to truly gain insight, we need to consider other information, too. Take risks, for example - Centuria Capital Group has 5 warning signs (and 1 which makes us a bit uncomfortable) we think you should know about.
Centuria Capital Group is not the only stock that insiders are buying. For those who like to find winning investments this free list of growing companies with recent insider purchasing, could be just the ticket.
Please note, the market returns quoted in this article reflect the market weighted average returns of stocks that currently trade on AU exchanges.
If you spot an error that warrants correction, please contact the editor at editorial-team@simplywallst.com. This article by Simply Wall St is general in nature. It does not constitute a recommendation to buy or sell any stock, and does not take account of your objectives, or your financial situation. Simply Wall St has no position in the stocks mentioned.
We aim to bring you long-term focused research analysis driven by fundamental data. Note that our analysis may not factor in the latest price-sensitive company announcements or qualitative material. Thank you for reading.
