
 Yahoo Finance
 The Case For Group 1 Automotive, Inc. (NYSE:GPI): Could It Be A Nice Addition To Your Dividend Portfolio?

Today we'll take a closer look at Group 1 Automotive, Inc. (NYSE:GPI) from a dividend investor's perspective. Owning a strong business and reinvesting the dividends is widely seen as an attractive way of growing your wealth. If you are hoping to live on the income from dividends, it's important to be a lot more stringent with your investments than the average punter.
With a 1.2% yield and a nine-year payment history, investors probably think Group 1 Automotive looks like a reliable dividend stock. A low yield is generally a turn-off, but if the prospects for earnings growth were strong, investors might be pleasantly surprised by the long-term results. The company also bought back stock during the year, equivalent to approximately 4.2% of the company's market capitalisation at the time. Some simple analysis can offer a lot of insights when buying a company for its dividend, and we'll go through this below.
Explore this interactive chart for our latest analysis on Group 1 Automotive!
Payout ratios
Companies (usually) pay dividends out of their earnings. If a company is paying more than it earns, the dividend might have to be cut. As a result, we should always investigate whether a company can afford its dividend, measured as a percentage of a company's net income after tax. In the last year, Group 1 Automotive paid out 11% of its profit as dividends. Given the low payout ratio, it is hard to envision the dividend coming under threat, barring a catastrophe.
Is Group 1 Automotive's Balance Sheet Risky?
As Group 1 Automotive has a meaningful amount of debt, we need to check its balance sheet to see if the company might have debt risks. A quick check of its financial situation can be done with two ratios: net debt divided by EBITDA (earnings before interest, tax, depreciation and amortisation), and net interest cover. Net debt to EBITDA measures total debt load relative to company earnings (lower = less debt), while net interest cover measures the ability to pay interest on the debt (higher = greater ability to pay interest costs). With net debt of 6.45 times its EBITDA, Group 1 Automotive could be described as a highly leveraged company. While some companies can handle this level of leverage, we'd be concerned about the dividend sustainability if there was any risk of an earnings downturn.
We calculated its interest cover by measuring its earnings before interest and tax (EBIT), and dividing this by the company's net interest expense. Interest cover of 2.97 times its interest expense is starting to become a concern for Group 1 Automotive, and be aware that lenders may place additional restrictions on the company as well. Low interest cover and high debt can create problems right when the investor least needs them, and we're reluctant to rely on the dividend of companies with these traits.
Remember, you can always get a snapshot of Group 1 Automotive's latest financial position, by checking our visualisation of its financial health.
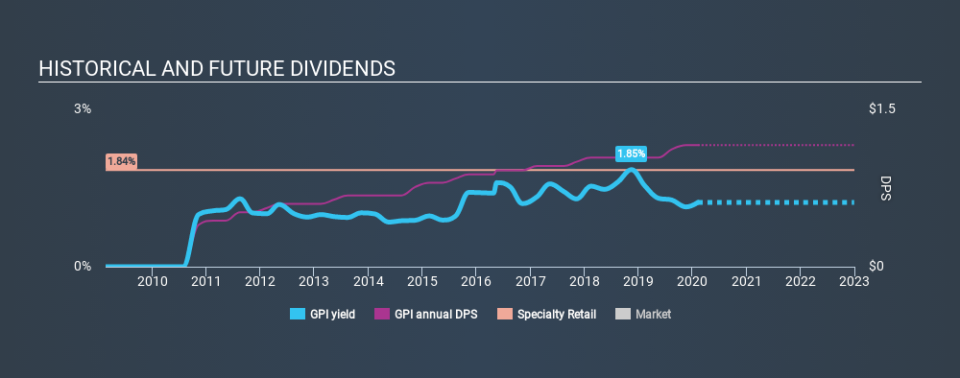
Dividend Volatility
From the perspective of an income investor who wants to earn dividends for many years, there is not much point buying a stock if its dividend is regularly cut or is not reliable. Looking at the last decade of data, we can see that Group 1 Automotive paid its first dividend at least nine years ago. The company has been paying a stable dividend for a while now, which is great. However we'd prefer to see consistency for a few more years before giving it our full seal of approval. During the past nine-year period, the first annual payment was US$0.40 in 2011, compared to US$1.16 last year. This works out to be a compound annual growth rate (CAGR) of approximately 13% a year over that time.
We're not overly excited about the relatively short history of dividend payments, however the dividend is growing at a nice rate and we might take a closer look.
Dividend Growth Potential
While dividend payments have been relatively reliable, it would also be nice if earnings per share (EPS) were growing, as this is essential to maintaining the dividend's purchasing power over the long term. Strong earnings per share (EPS) growth might encourage our interest in the company despite fluctuating dividends, which is why it's great to see Group 1 Automotive has grown its earnings per share at 21% per annum over the past five years. Earnings per share have grown rapidly, and the company is retaining a majority of its earnings. We think this is ideal from an investment perspective, if the company is able to reinvest these earnings effectively.
Conclusion
When we look at a dividend stock, we need to form a judgement on whether the dividend will grow, if the company is able to maintain it in a wide range of economic circumstances, and if the dividend payout is sustainable. Firstly, we like that Group 1 Automotive has a low and conservative payout ratio. Next, earnings growth has been good, but unfortunately the company has not been paying dividends as long as we'd like. Overall, we think there are a lot of positives to Group 1 Automotive from a dividend perspective.
Companies that are growing earnings tend to be the best dividend stocks over the long term. See what the 5 analysts we track are forecasting for Group 1 Automotive for free with public analyst estimates for the company.
We have also put together a list of global stocks with a market capitalisation above $1bn and yielding more 3%.
If you spot an error that warrants correction, please contact the editor at editorial-team@simplywallst.com. This article by Simply Wall St is general in nature. It does not constitute a recommendation to buy or sell any stock, and does not take account of your objectives, or your financial situation. Simply Wall St has no position in the stocks mentioned.
We aim to bring you long-term focused research analysis driven by fundamental data. Note that our analysis may not factor in the latest price-sensitive company announcements or qualitative material. Thank you for reading.
