
 Yahoo Finance
 Capricorn Metals' (ASX:CMM) Returns On Capital Are Heading Higher
If you're looking for a multi-bagger, there's a few things to keep an eye out for. In a perfect world, we'd like to see a company investing more capital into its business and ideally the returns earned from that capital are also increasing. Basically this means that a company has profitable initiatives that it can continue to reinvest in, which is a trait of a compounding machine. So on that note, Capricorn Metals (ASX:CMM) looks quite promising in regards to its trends of return on capital.
Return On Capital Employed (ROCE): What is it?
For those that aren't sure what ROCE is, it measures the amount of pre-tax profits a company can generate from the capital employed in its business. To calculate this metric for Capricorn Metals, this is the formula:
Return on Capital Employed = Earnings Before Interest and Tax (EBIT) ÷ (Total Assets - Current Liabilities)
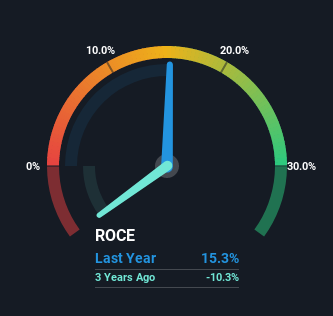
0.15 = AU$50m ÷ (AU$387m - AU$61m) (Based on the trailing twelve months to December 2021).
Therefore, Capricorn Metals has an ROCE of 15%. In absolute terms, that's a satisfactory return, but compared to the Metals and Mining industry average of 8.7% it's much better.
See our latest analysis for Capricorn Metals
Above you can see how the current ROCE for Capricorn Metals compares to its prior returns on capital, but there's only so much you can tell from the past. If you're interested, you can view the analysts predictions in our free report on analyst forecasts for the company.
The Trend Of ROCE
The fact that Capricorn Metals is now generating some pre-tax profits from its prior investments is very encouraging. The company was generating losses five years ago, but now it's earning 15% which is a sight for sore eyes. And unsurprisingly, like most companies trying to break into the black, Capricorn Metals is utilizing 1,315% more capital than it was five years ago. This can indicate that there's plenty of opportunities to invest capital internally and at ever higher rates, both common traits of a multi-bagger.
For the record though, there was a noticeable increase in the company's current liabilities over the period, so we would attribute some of the ROCE growth to that. Essentially the business now has suppliers or short-term creditors funding about 16% of its operations, which isn't ideal. Keep an eye out for future increases because when the ratio of current liabilities to total assets gets particularly high, this can introduce some new risks for the business.
Our Take On Capricorn Metals' ROCE
To the delight of most shareholders, Capricorn Metals has now broken into profitability. And with the stock having performed exceptionally well over the last five years, these patterns are being accounted for by investors. Therefore, we think it would be worth your time to check if these trends are going to continue.
If you'd like to know more about Capricorn Metals, we've spotted 3 warning signs, and 1 of them makes us a bit uncomfortable.
While Capricorn Metals may not currently earn the highest returns, we've compiled a list of companies that currently earn more than 25% return on equity. Check out this free list here.
Have feedback on this article? Concerned about the content? Get in touch with us directly. Alternatively, email editorial-team (at) simplywallst.com.
This article by Simply Wall St is general in nature. We provide commentary based on historical data and analyst forecasts only using an unbiased methodology and our articles are not intended to be financial advice. It does not constitute a recommendation to buy or sell any stock, and does not take account of your objectives, or your financial situation. We aim to bring you long-term focused analysis driven by fundamental data. Note that our analysis may not factor in the latest price-sensitive company announcements or qualitative material. Simply Wall St has no position in any stocks mentioned.
