
 Yahoo Finance
 Capital Allocation Trends At Shriro Holdings (ASX:SHM) Aren't Ideal
There are a few key trends to look for if we want to identify the next multi-bagger. Ideally, a business will show two trends; firstly a growing return on capital employed (ROCE) and secondly, an increasing amount of capital employed. This shows us that it's a compounding machine, able to continually reinvest its earnings back into the business and generate higher returns. Having said that, from a first glance at Shriro Holdings (ASX:SHM) we aren't jumping out of our chairs at how returns are trending, but let's have a deeper look.
Understanding Return On Capital Employed (ROCE)
If you haven't worked with ROCE before, it measures the 'return' (pre-tax profit) a company generates from capital employed in its business. To calculate this metric for Shriro Holdings, this is the formula:
Return on Capital Employed = Earnings Before Interest and Tax (EBIT) ÷ (Total Assets - Current Liabilities)
0.18 = AU$14m ÷ (AU$110m - AU$31m) (Based on the trailing twelve months to December 2021).
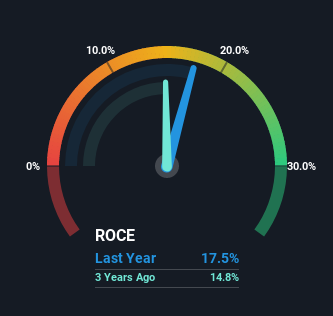
Therefore, Shriro Holdings has an ROCE of 18%. On its own, that's a standard return, however it's much better than the 14% generated by the Consumer Durables industry.
Check out our latest analysis for Shriro Holdings
While the past is not representative of the future, it can be helpful to know how a company has performed historically, which is why we have this chart above. If you want to delve into the historical earnings, revenue and cash flow of Shriro Holdings, check out these free graphs here.
What Can We Tell From Shriro Holdings' ROCE Trend?
In terms of Shriro Holdings' historical ROCE movements, the trend isn't fantastic. Over the last five years, returns on capital have decreased to 18% from 33% five years ago. And considering revenue has dropped while employing more capital, we'd be cautious. If this were to continue, you might be looking at a company that is trying to reinvest for growth but is actually losing market share since sales haven't increased.
The Bottom Line On Shriro Holdings' ROCE
From the above analysis, we find it rather worrisome that returns on capital and sales for Shriro Holdings have fallen, meanwhile the business is employing more capital than it was five years ago. In spite of that, the stock has delivered a 10% return to shareholders who held over the last five years. Either way, we aren't huge fans of the current trends and so with that we think you might find better investments elsewhere.
Shriro Holdings does have some risks, we noticed 4 warning signs (and 2 which are a bit concerning) we think you should know about.
While Shriro Holdings isn't earning the highest return, check out this free list of companies that are earning high returns on equity with solid balance sheets.
Have feedback on this article? Concerned about the content? Get in touch with us directly. Alternatively, email editorial-team (at) simplywallst.com.
This article by Simply Wall St is general in nature. We provide commentary based on historical data and analyst forecasts only using an unbiased methodology and our articles are not intended to be financial advice. It does not constitute a recommendation to buy or sell any stock, and does not take account of your objectives, or your financial situation. We aim to bring you long-term focused analysis driven by fundamental data. Note that our analysis may not factor in the latest price-sensitive company announcements or qualitative material. Simply Wall St has no position in any stocks mentioned.
