
 Yahoo Finance
 Capital Allocation Trends At Marten Transport (NASDAQ:MRTN) Aren't Ideal
Did you know there are some financial metrics that can provide clues of a potential multi-bagger? Ideally, a business will show two trends; firstly a growing return on capital employed (ROCE) and secondly, an increasing amount of capital employed. This shows us that it's a compounding machine, able to continually reinvest its earnings back into the business and generate higher returns. However, after investigating Marten Transport (NASDAQ:MRTN), we don't think it's current trends fit the mold of a multi-bagger.
Return On Capital Employed (ROCE): What Is It?
If you haven't worked with ROCE before, it measures the 'return' (pre-tax profit) a company generates from capital employed in its business. To calculate this metric for Marten Transport, this is the formula:
Return on Capital Employed = Earnings Before Interest and Tax (EBIT) ÷ (Total Assets - Current Liabilities)
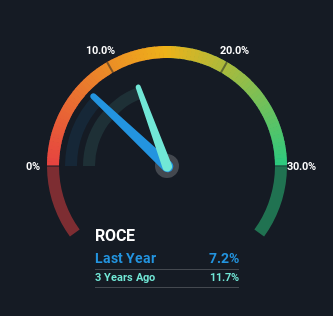
0.072 = US$64m ÷ (US$993m - US$111m) (Based on the trailing twelve months to March 2024).
Therefore, Marten Transport has an ROCE of 7.2%. On its own that's a low return on capital but it's in line with the industry's average returns of 7.1%.
See our latest analysis for Marten Transport
In the above chart we have measured Marten Transport's prior ROCE against its prior performance, but the future is arguably more important. If you'd like to see what analysts are forecasting going forward, you should check out our free analyst report for Marten Transport .
How Are Returns Trending?
In terms of Marten Transport's historical ROCE movements, the trend isn't fantastic. To be more specific, ROCE has fallen from 9.6% over the last five years. And considering revenue has dropped while employing more capital, we'd be cautious. If this were to continue, you might be looking at a company that is trying to reinvest for growth but is actually losing market share since sales haven't increased.
The Key Takeaway
From the above analysis, we find it rather worrisome that returns on capital and sales for Marten Transport have fallen, meanwhile the business is employing more capital than it was five years ago. Yet despite these concerning fundamentals, the stock has performed strongly with a 67% return over the last five years, so investors appear very optimistic. In any case, the current underlying trends don't bode well for long term performance so unless they reverse, we'd start looking elsewhere.
If you want to continue researching Marten Transport, you might be interested to know about the 1 warning sign that our analysis has discovered.
While Marten Transport may not currently earn the highest returns, we've compiled a list of companies that currently earn more than 25% return on equity. Check out this free list here.
Have feedback on this article? Concerned about the content? Get in touch with us directly. Alternatively, email editorial-team (at) simplywallst.com.
This article by Simply Wall St is general in nature. We provide commentary based on historical data and analyst forecasts only using an unbiased methodology and our articles are not intended to be financial advice. It does not constitute a recommendation to buy or sell any stock, and does not take account of your objectives, or your financial situation. We aim to bring you long-term focused analysis driven by fundamental data. Note that our analysis may not factor in the latest price-sensitive company announcements or qualitative material. Simply Wall St has no position in any stocks mentioned.
