
 Yahoo Finance
 Capital Allocation Trends At Booking Holdings (NASDAQ:BKNG) Aren't Ideal
Ignoring the stock price of a company, what are the underlying trends that tell us a business is past the growth phase? When we see a declining return on capital employed (ROCE) in conjunction with a declining base of capital employed, that's often how a mature business shows signs of aging. This indicates the company is producing less profit from its investments and its total assets are decreasing. Having said that, after a brief look, Booking Holdings (NASDAQ:BKNG) we aren't filled with optimism, but let's investigate further.
Understanding Return On Capital Employed (ROCE)
For those that aren't sure what ROCE is, it measures the amount of pre-tax profits a company can generate from the capital employed in its business. Analysts use this formula to calculate it for Booking Holdings:
Return on Capital Employed = Earnings Before Interest and Tax (EBIT) ÷ (Total Assets - Current Liabilities)
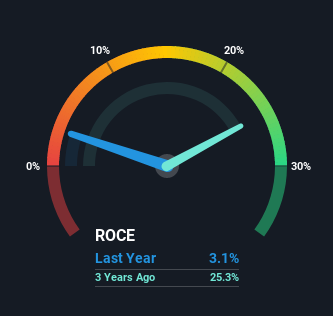
0.031 = US$529m ÷ (US$24b - US$6.7b) (Based on the trailing twelve months to June 2021).
So, Booking Holdings has an ROCE of 3.1%. Ultimately, that's a low return and it under-performs the Hospitality industry average of 7.7%.
See our latest analysis for Booking Holdings
In the above chart we have measured Booking Holdings' prior ROCE against its prior performance, but the future is arguably more important. If you'd like to see what analysts are forecasting going forward, you should check out our free report for Booking Holdings.
So How Is Booking Holdings' ROCE Trending?
There is reason to be cautious about Booking Holdings, given the returns are trending downwards. Unfortunately the returns on capital have diminished from the 20% that they were earning five years ago. On top of that, it's worth noting that the amount of capital employed within the business has remained relatively steady. This combination can be indicative of a mature business that still has areas to deploy capital, but the returns received aren't as high due potentially to new competition or smaller margins. So because these trends aren't typically conducive to creating a multi-bagger, we wouldn't hold our breath on Booking Holdings becoming one if things continue as they have.
On a side note, Booking Holdings' current liabilities have increased over the last five years to 28% of total assets, effectively distorting the ROCE to some degree. If current liabilities hadn't increased as much as they did, the ROCE could actually be even lower. Keep an eye on this ratio, because the business could encounter some new risks if this metric gets too high.
The Bottom Line On Booking Holdings' ROCE
All in all, the lower returns from the same amount of capital employed aren't exactly signs of a compounding machine. However the stock has delivered a 73% return to shareholders over the last five years, so investors might be expecting the trends to turn around. Regardless, we don't feel too comfortable with the fundamentals so we'd be steering clear of this stock for now.
If you'd like to know more about Booking Holdings, we've spotted 3 warning signs, and 1 of them doesn't sit too well with us.
If you want to search for solid companies with great earnings, check out this free list of companies with good balance sheets and impressive returns on equity.
This article by Simply Wall St is general in nature. We provide commentary based on historical data and analyst forecasts only using an unbiased methodology and our articles are not intended to be financial advice. It does not constitute a recommendation to buy or sell any stock, and does not take account of your objectives, or your financial situation. We aim to bring you long-term focused analysis driven by fundamental data. Note that our analysis may not factor in the latest price-sensitive company announcements or qualitative material. Simply Wall St has no position in any stocks mentioned.
Have feedback on this article? Concerned about the content? Get in touch with us directly. Alternatively, email editorial-team (at) simplywallst.com.
