
 Yahoo Finance
 When Will Calidus Resources Limited (ASX:CAI) Turn A Profit?

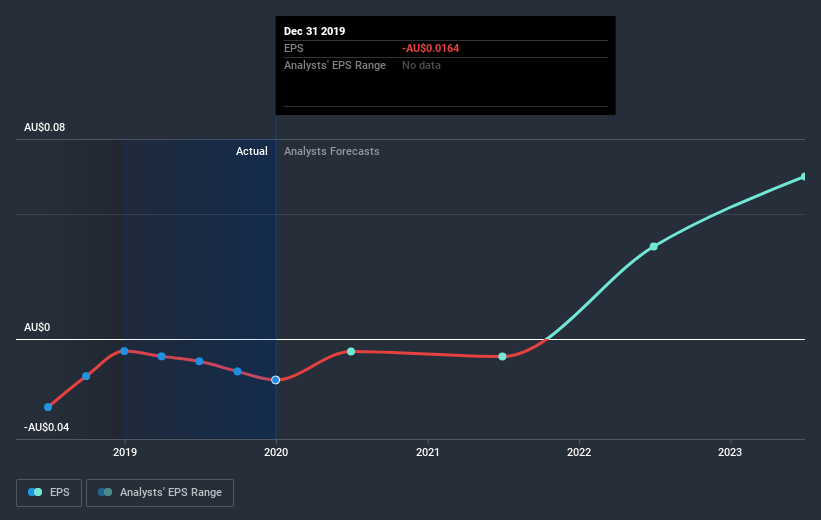
We feel now is a pretty good time to analyse Calidus Resources Limited's (ASX:CAI) business as it appears the company may be on the cusp of a considerable accomplishment. Calidus Resources Limited engages in the exploration and exploitation of gold minerals in Australia. The AU$147m market-cap company posted a loss in its most recent financial year of AU$1.2m and a latest trailing-twelve-month loss of AU$2.7m leading to an even wider gap between loss and breakeven. As path to profitability is the topic on Calidus Resources' investors mind, we've decided to gauge market sentiment. We've put together a brief outline of industry analyst expectations for the company, its year of breakeven and its implied growth rate.
See our latest analysis for Calidus Resources
Expectations from some of the Australian Metals and Mining analysts is that Calidus Resources is on the verge of breakeven. They anticipate the company to incur a final loss in 2021, before generating positive profits of AU$38m in 2022. The company is therefore projected to breakeven around 2 years from today. In order to meet this breakeven date, we calculated the rate at which the company must grow year-on-year. It turns out an average annual growth rate of 88% is expected, which signals high confidence from analysts. Should the business grow at a slower rate, it will become profitable at a later date than expected.
Underlying developments driving Calidus Resources' growth isn’t the focus of this broad overview, however, keep in mind that typically metals and mining companies, depending on the stage of operation and metals mined, have irregular periods of cash flow. This means, large upcoming growth rates are not abnormal as the company is beginning to reap the benefits of earlier investments.
One thing we’d like to point out is that Calidus Resources has no debt on its balance sheet, which is rare for a loss-making metals and mining company, which typically has high debt relative to its equity. The company currently operates purely off its shareholder funding and has no debt obligation, reducing concerns around repayments and making it a less risky investment.
Next Steps:
There are key fundamentals of Calidus Resources which are not covered in this article, but we must stress again that this is merely a basic overview. For a more comprehensive look at Calidus Resources, take a look at Calidus Resources' company page on Simply Wall St. We've also compiled a list of essential factors you should look at:
Historical Track Record: What has Calidus Resources' performance been like over the past? Go into more detail in the past track record analysis and take a look at the free visual representations of our analysis for more clarity.
Management Team: An experienced management team on the helm increases our confidence in the business – take a look at who sits on Calidus Resources' board and the CEO’s background.
Other High-Performing Stocks: Are there other stocks that provide better prospects with proven track records? Explore our free list of these great stocks here.
This article by Simply Wall St is general in nature. It does not constitute a recommendation to buy or sell any stock, and does not take account of your objectives, or your financial situation. We aim to bring you long-term focused analysis driven by fundamental data. Note that our analysis may not factor in the latest price-sensitive company announcements or qualitative material. Simply Wall St has no position in any stocks mentioned.
Have feedback on this article? Concerned about the content? Get in touch with us directly. Alternatively, email editorial-team@simplywallst.com.
