
 Yahoo Finance
 Calculating The Intrinsic Value Of Northern Star Resources Limited (ASX:NST)
Key Insights
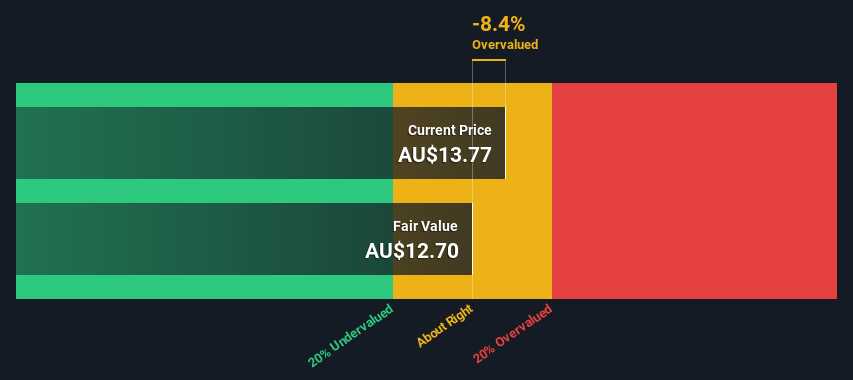
Northern Star Resources' estimated fair value is AU$12.70 based on 2 Stage Free Cash Flow to Equity
Northern Star Resources' AU$13.77 share price indicates it is trading at similar levels as its fair value estimate
Our fair value estimate is 7.6% lower than Northern Star Resources' analyst price target of AU$13.75
Today we'll do a simple run through of a valuation method used to estimate the attractiveness of Northern Star Resources Limited (ASX:NST) as an investment opportunity by taking the expected future cash flows and discounting them to their present value. This will be done using the Discounted Cash Flow (DCF) model. There's really not all that much to it, even though it might appear quite complex.
We generally believe that a company's value is the present value of all of the cash it will generate in the future. However, a DCF is just one valuation metric among many, and it is not without flaws. Anyone interested in learning a bit more about intrinsic value should have a read of the Simply Wall St analysis model.
See our latest analysis for Northern Star Resources
The Method
We use what is known as a 2-stage model, which simply means we have two different periods of growth rates for the company's cash flows. Generally the first stage is higher growth, and the second stage is a lower growth phase. In the first stage we need to estimate the cash flows to the business over the next ten years. Where possible we use analyst estimates, but when these aren't available we extrapolate the previous free cash flow (FCF) from the last estimate or reported value. We assume companies with shrinking free cash flow will slow their rate of shrinkage, and that companies with growing free cash flow will see their growth rate slow, over this period. We do this to reflect that growth tends to slow more in the early years than it does in later years.
Generally we assume that a dollar today is more valuable than a dollar in the future, and so the sum of these future cash flows is then discounted to today's value:
10-year free cash flow (FCF) forecast
2023 | 2024 | 2025 | 2026 | 2027 | 2028 | 2029 | 2030 | 2031 | 2032 | |
Levered FCF (A$, Millions) | AU$345.8m | AU$1.18b | AU$1.33b | AU$1.22b | AU$1.16b | AU$1.12b | AU$1.11b | AU$1.10b | AU$1.10b | AU$1.11b |
Growth Rate Estimate Source | Analyst x4 | Analyst x4 | Analyst x4 | Analyst x2 | Est @ -5.06% | Est @ -2.96% | Est @ -1.48% | Est @ -0.45% | Est @ 0.27% | Est @ 0.78% |
Present Value (A$, Millions) Discounted @ 8.5% | AU$319 | AU$1.0k | AU$1.0k | AU$880 | AU$770 | AU$689 | AU$625 | AU$574 | AU$530 | AU$493 |
("Est" = FCF growth rate estimated by Simply Wall St)
Present Value of 10-year Cash Flow (PVCF) = AU$6.9b
After calculating the present value of future cash flows in the initial 10-year period, we need to calculate the Terminal Value, which accounts for all future cash flows beyond the first stage. For a number of reasons a very conservative growth rate is used that cannot exceed that of a country's GDP growth. In this case we have used the 5-year average of the 10-year government bond yield (2.0%) to estimate future growth. In the same way as with the 10-year 'growth' period, we discount future cash flows to today's value, using a cost of equity of 8.5%.
Terminal Value (TV)= FCF2032 × (1 + g) ÷ (r – g) = AU$1.1b× (1 + 2.0%) ÷ (8.5%– 2.0%) = AU$17b
Present Value of Terminal Value (PVTV)= TV / (1 + r)10= AU$17b÷ ( 1 + 8.5%)10= AU$7.7b
The total value, or equity value, is then the sum of the present value of the future cash flows, which in this case is AU$15b. The last step is to then divide the equity value by the number of shares outstanding. Relative to the current share price of AU$13.8, the company appears around fair value at the time of writing. The assumptions in any calculation have a big impact on the valuation, so it is better to view this as a rough estimate, not precise down to the last cent.
Important Assumptions
We would point out that the most important inputs to a discounted cash flow are the discount rate and of course the actual cash flows. Part of investing is coming up with your own evaluation of a company's future performance, so try the calculation yourself and check your own assumptions. The DCF also does not consider the possible cyclicality of an industry, or a company's future capital requirements, so it does not give a full picture of a company's potential performance. Given that we are looking at Northern Star Resources as potential shareholders, the cost of equity is used as the discount rate, rather than the cost of capital (or weighted average cost of capital, WACC) which accounts for debt. In this calculation we've used 8.5%, which is based on a levered beta of 1.101. Beta is a measure of a stock's volatility, compared to the market as a whole. We get our beta from the industry average beta of globally comparable companies, with an imposed limit between 0.8 and 2.0, which is a reasonable range for a stable business.
SWOT Analysis for Northern Star Resources
Strength
Debt is not viewed as a risk.
Weakness
Earnings declined over the past year.
Dividend is low compared to the top 25% of dividend payers in the Metals and Mining market.
Expensive based on P/E ratio and estimated fair value.
Opportunity
Annual earnings are forecast to grow faster than the Australian market.
Threat
Dividends are not covered by earnings.
Revenue is forecast to grow slower than 20% per year.
Next Steps:
Whilst important, the DCF calculation shouldn't be the only metric you look at when researching a company. DCF models are not the be-all and end-all of investment valuation. Preferably you'd apply different cases and assumptions and see how they would impact the company's valuation. For instance, if the terminal value growth rate is adjusted slightly, it can dramatically alter the overall result. For Northern Star Resources, we've put together three relevant factors you should assess:
Risks: As an example, we've found 3 warning signs for Northern Star Resources that you need to consider before investing here.
Management:Have insiders been ramping up their shares to take advantage of the market's sentiment for NST's future outlook? Check out our management and board analysis with insights on CEO compensation and governance factors.
Other High Quality Alternatives: Do you like a good all-rounder? Explore our interactive list of high quality stocks to get an idea of what else is out there you may be missing!
PS. Simply Wall St updates its DCF calculation for every Australian stock every day, so if you want to find the intrinsic value of any other stock just search here.
Have feedback on this article? Concerned about the content? Get in touch with us directly. Alternatively, email editorial-team (at) simplywallst.com.
This article by Simply Wall St is general in nature. We provide commentary based on historical data and analyst forecasts only using an unbiased methodology and our articles are not intended to be financial advice. It does not constitute a recommendation to buy or sell any stock, and does not take account of your objectives, or your financial situation. We aim to bring you long-term focused analysis driven by fundamental data. Note that our analysis may not factor in the latest price-sensitive company announcements or qualitative material. Simply Wall St has no position in any stocks mentioned.
Join A Paid User Research Session
You’ll receive a US$30 Amazon Gift card for 1 hour of your time while helping us build better investing tools for the individual investors like yourself. Sign up here
