
 Yahoo Finance
 Calculating The Intrinsic Value Of Newcrest Mining Limited (ASX:NCM)
Today we will run through one way of estimating the intrinsic value of Newcrest Mining Limited (ASX:NCM) by projecting its future cash flows and then discounting them to today's value. We will use the Discounted Cash Flow (DCF) model on this occasion. It may sound complicated, but actually it is quite simple!
Remember though, that there are many ways to estimate a company's value, and a DCF is just one method. If you still have some burning questions about this type of valuation, take a look at the Simply Wall St analysis model.
View our latest analysis for Newcrest Mining
Step by step through the calculation
We're using the 2-stage growth model, which simply means we take in account two stages of company's growth. In the initial period the company may have a higher growth rate and the second stage is usually assumed to have a stable growth rate. To start off with, we need to estimate the next ten years of cash flows. Where possible we use analyst estimates, but when these aren't available we extrapolate the previous free cash flow (FCF) from the last estimate or reported value. We assume companies with shrinking free cash flow will slow their rate of shrinkage, and that companies with growing free cash flow will see their growth rate slow, over this period. We do this to reflect that growth tends to slow more in the early years than it does in later years.
Generally we assume that a dollar today is more valuable than a dollar in the future, so we need to discount the sum of these future cash flows to arrive at a present value estimate:
10-year free cash flow (FCF) estimate
2023 | 2024 | 2025 | 2026 | 2027 | 2028 | 2029 | 2030 | 2031 | 2032 | |
Levered FCF ($, Millions) | US$665.6m | US$578.6m | US$554.3m | US$541.0m | US$534.9m | US$533.7m | US$535.7m | US$540.1m | US$546.1m | US$553.4m |
Growth Rate Estimate Source | Analyst x7 | Analyst x5 | Est @ -4.2% | Est @ -2.39% | Est @ -1.13% | Est @ -0.24% | Est @ 0.38% | Est @ 0.82% | Est @ 1.12% | Est @ 1.33% |
Present Value ($, Millions) Discounted @ 6.6% | US$624 | US$509 | US$458 | US$419 | US$389 | US$364 | US$343 | US$324 | US$308 | US$293 |
("Est" = FCF growth rate estimated by Simply Wall St)
Present Value of 10-year Cash Flow (PVCF) = US$4.0b
After calculating the present value of future cash flows in the initial 10-year period, we need to calculate the Terminal Value, which accounts for all future cash flows beyond the first stage. The Gordon Growth formula is used to calculate Terminal Value at a future annual growth rate equal to the 5-year average of the 10-year government bond yield of 1.8%. We discount the terminal cash flows to today's value at a cost of equity of 6.6%.
Terminal Value (TV)= FCF2032 × (1 + g) ÷ (r – g) = US$553m× (1 + 1.8%) ÷ (6.6%– 1.8%) = US$12b
Present Value of Terminal Value (PVTV)= TV / (1 + r)10= US$12b÷ ( 1 + 6.6%)10= US$6.3b
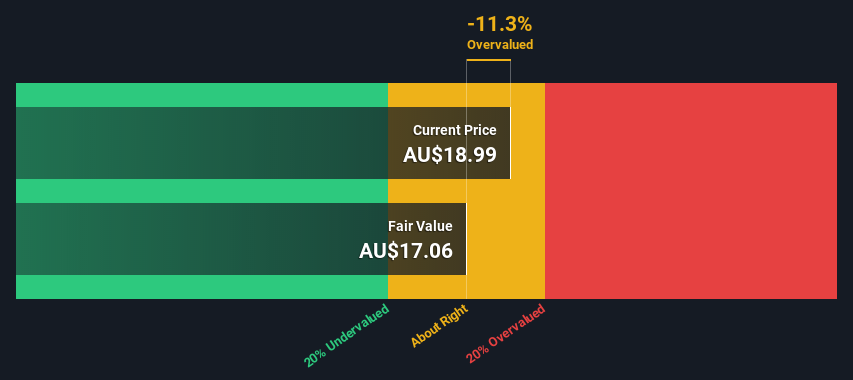
The total value is the sum of cash flows for the next ten years plus the discounted terminal value, which results in the Total Equity Value, which in this case is US$10b. To get the intrinsic value per share, we divide this by the total number of shares outstanding. Compared to the current share price of AU$19.0, the company appears around fair value at the time of writing. Valuations are imprecise instruments though, rather like a telescope - move a few degrees and end up in a different galaxy. Do keep this in mind.
The assumptions
The calculation above is very dependent on two assumptions. The first is the discount rate and the other is the cash flows. You don't have to agree with these inputs, I recommend redoing the calculations yourself and playing with them. The DCF also does not consider the possible cyclicality of an industry, or a company's future capital requirements, so it does not give a full picture of a company's potential performance. Given that we are looking at Newcrest Mining as potential shareholders, the cost of equity is used as the discount rate, rather than the cost of capital (or weighted average cost of capital, WACC) which accounts for debt. In this calculation we've used 6.6%, which is based on a levered beta of 1.121. Beta is a measure of a stock's volatility, compared to the market as a whole. We get our beta from the industry average beta of globally comparable companies, with an imposed limit between 0.8 and 2.0, which is a reasonable range for a stable business.
Looking Ahead:
Whilst important, the DCF calculation is only one of many factors that you need to assess for a company. It's not possible to obtain a foolproof valuation with a DCF model. Rather it should be seen as a guide to "what assumptions need to be true for this stock to be under/overvalued?" If a company grows at a different rate, or if its cost of equity or risk free rate changes sharply, the output can look very different. For Newcrest Mining, we've put together three pertinent elements you should explore:
Risks: Case in point, we've spotted 3 warning signs for Newcrest Mining you should be aware of, and 1 of them is a bit unpleasant.
Management:Have insiders been ramping up their shares to take advantage of the market's sentiment for NCM's future outlook? Check out our management and board analysis with insights on CEO compensation and governance factors.
Other High Quality Alternatives: Do you like a good all-rounder? Explore our interactive list of high quality stocks to get an idea of what else is out there you may be missing!
PS. Simply Wall St updates its DCF calculation for every Australian stock every day, so if you want to find the intrinsic value of any other stock just search here.
Have feedback on this article? Concerned about the content? Get in touch with us directly. Alternatively, email editorial-team (at) simplywallst.com.
This article by Simply Wall St is general in nature. We provide commentary based on historical data and analyst forecasts only using an unbiased methodology and our articles are not intended to be financial advice. It does not constitute a recommendation to buy or sell any stock, and does not take account of your objectives, or your financial situation. We aim to bring you long-term focused analysis driven by fundamental data. Note that our analysis may not factor in the latest price-sensitive company announcements or qualitative material. Simply Wall St has no position in any stocks mentioned.
Join A Paid User Research Session
You’ll receive a US$30 Amazon Gift card for 1 hour of your time while helping us build better investing tools for the individual investors like yourself. Sign up here
