
 Yahoo Finance
 C.H. Robinson Worldwide's (NASDAQ:CHRW) three-year earnings growth trails the decent shareholder returns
It hasn't been the best quarter for C.H. Robinson Worldwide, Inc. (NASDAQ:CHRW) shareholders, since the share price has fallen 11% in that time. On the other hand the share price is higher than it was three years ago. Arguably you'd have been better off buying an index fund, because the gain of 25% in three years isn't amazing.
The past week has proven to be lucrative for C.H. Robinson Worldwide investors, so let's see if fundamentals drove the company's three-year performance.
Check out our latest analysis for C.H. Robinson Worldwide
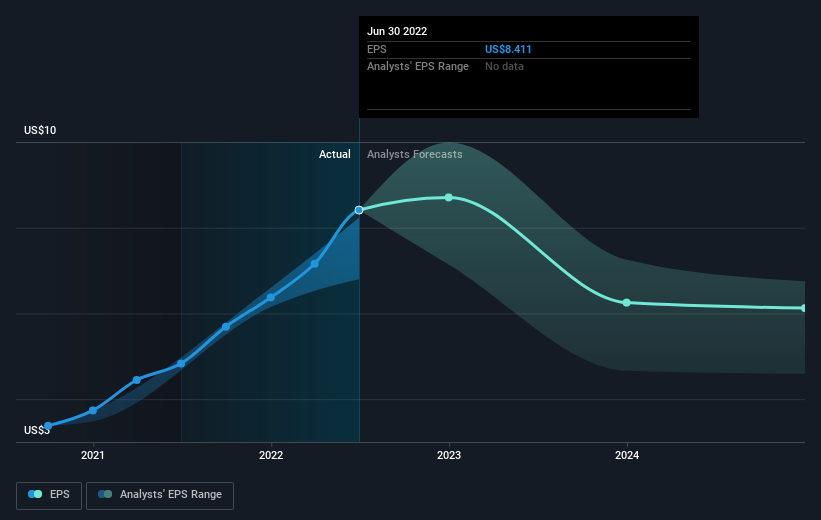
To quote Buffett, 'Ships will sail around the world but the Flat Earth Society will flourish. There will continue to be wide discrepancies between price and value in the marketplace...' By comparing earnings per share (EPS) and share price changes over time, we can get a feel for how investor attitudes to a company have morphed over time.
During three years of share price growth, C.H. Robinson Worldwide achieved compound earnings per share growth of 21% per year. The average annual share price increase of 8% is actually lower than the EPS growth. So it seems investors have become more cautious about the company, over time. We'd venture the lowish P/E ratio of 10.91 also reflects the negative sentiment around the stock.
The graphic below depicts how EPS has changed over time (unveil the exact values by clicking on the image).
We know that C.H. Robinson Worldwide has improved its bottom line lately, but is it going to grow revenue? If you're interested, you could check this free report showing consensus revenue forecasts.
What About Dividends?
As well as measuring the share price return, investors should also consider the total shareholder return (TSR). Whereas the share price return only reflects the change in the share price, the TSR includes the value of dividends (assuming they were reinvested) and the benefit of any discounted capital raising or spin-off. Arguably, the TSR gives a more comprehensive picture of the return generated by a stock. As it happens, C.H. Robinson Worldwide's TSR for the last 3 years was 34%, which exceeds the share price return mentioned earlier. And there's no prize for guessing that the dividend payments largely explain the divergence!
A Different Perspective
It's nice to see that C.H. Robinson Worldwide shareholders have received a total shareholder return of 0.9% over the last year. Of course, that includes the dividend. However, the TSR over five years, coming in at 6% per year, is even more impressive. Potential buyers might understandably feel they've missed the opportunity, but it's always possible business is still firing on all cylinders. I find it very interesting to look at share price over the long term as a proxy for business performance. But to truly gain insight, we need to consider other information, too. Take risks, for example - C.H. Robinson Worldwide has 5 warning signs (and 3 which shouldn't be ignored) we think you should know about.
If you would prefer to check out another company -- one with potentially superior financials -- then do not miss this free list of companies that have proven they can grow earnings.
Please note, the market returns quoted in this article reflect the market weighted average returns of stocks that currently trade on US exchanges.
Have feedback on this article? Concerned about the content? Get in touch with us directly. Alternatively, email editorial-team (at) simplywallst.com.
This article by Simply Wall St is general in nature. We provide commentary based on historical data and analyst forecasts only using an unbiased methodology and our articles are not intended to be financial advice. It does not constitute a recommendation to buy or sell any stock, and does not take account of your objectives, or your financial situation. We aim to bring you long-term focused analysis driven by fundamental data. Note that our analysis may not factor in the latest price-sensitive company announcements or qualitative material. Simply Wall St has no position in any stocks mentioned.
Join A Paid User Research Session
You’ll receive a US$30 Amazon Gift card for 1 hour of your time while helping us build better investing tools for the individual investors like yourself. Sign up here
