
 Yahoo Finance
 Do You Like C.H. Robinson Worldwide, Inc. (NASDAQ:CHRW) At This P/E Ratio?

The goal of this article is to teach you how to use price to earnings ratios (P/E ratios). We'll apply a basic P/E ratio analysis to C.H. Robinson Worldwide, Inc.'s (NASDAQ:CHRW), to help you decide if the stock is worth further research. Looking at earnings over the last twelve months, C.H. Robinson Worldwide has a P/E ratio of 16.10. That is equivalent to an earnings yield of about 6.2%.
View our latest analysis for C.H. Robinson Worldwide
How Do You Calculate C.H. Robinson Worldwide's P/E Ratio?
The formula for price to earnings is:
Price to Earnings Ratio = Share Price ÷ Earnings per Share (EPS)
Or for C.H. Robinson Worldwide:
P/E of 16.10 = $77.93 ÷ $4.84 (Based on the trailing twelve months to September 2019.)
Is A High Price-to-Earnings Ratio Good?
A higher P/E ratio means that investors are paying a higher price for each $1 of company earnings. All else being equal, it's better to pay a low price -- but as Warren Buffett said, 'It's far better to buy a wonderful company at a fair price than a fair company at a wonderful price'.
How Does C.H. Robinson Worldwide's P/E Ratio Compare To Its Peers?
We can get an indication of market expectations by looking at the P/E ratio. We can see in the image below that the average P/E (20.6) for companies in the logistics industry is higher than C.H. Robinson Worldwide's P/E.
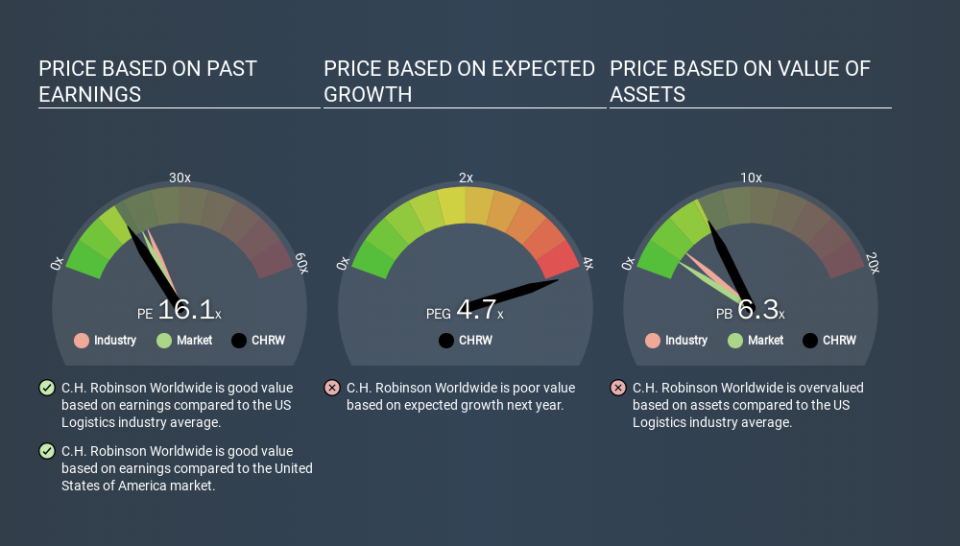
This suggests that market participants think C.H. Robinson Worldwide will underperform other companies in its industry. Since the market seems unimpressed with C.H. Robinson Worldwide, it's quite possible it could surprise on the upside. It is arguably worth checking if insiders are buying shares, because that might imply they believe the stock is undervalued.
How Growth Rates Impact P/E Ratios
Generally speaking the rate of earnings growth has a profound impact on a company's P/E multiple. If earnings are growing quickly, then the 'E' in the equation will increase faster than it would otherwise. Therefore, even if you pay a high multiple of earnings now, that multiple will become lower in the future. And as that P/E ratio drops, the company will look cheap, unless its share price increases.
C.H. Robinson Worldwide saw earnings per share improve by -7.2% last year. And earnings per share have improved by 11% annually, over the last five years.
Don't Forget: The P/E Does Not Account For Debt or Bank Deposits
Don't forget that the P/E ratio considers market capitalization. So it won't reflect the advantage of cash, or disadvantage of debt. The exact same company would hypothetically deserve a higher P/E ratio if it had a strong balance sheet, than if it had a weak one with lots of debt, because a cashed up company can spend on growth.
Such expenditure might be good or bad, in the long term, but the point here is that the balance sheet is not reflected by this ratio.
So What Does C.H. Robinson Worldwide's Balance Sheet Tell Us?
C.H. Robinson Worldwide has net debt worth just 8.2% of its market capitalization. So it doesn't have as many options as it would with net cash, but its debt would not have much of an impact on its P/E ratio.
The Verdict On C.H. Robinson Worldwide's P/E Ratio
C.H. Robinson Worldwide's P/E is 16.1 which is below average (18.9) in the US market. The company does have a little debt, and EPS is moving in the right direction. The P/E ratio implies the market is cautious about longer term prospects.
Investors have an opportunity when market expectations about a stock are wrong. If it is underestimating a company, investors can make money by buying and holding the shares until the market corrects itself. So this free visual report on analyst forecasts could hold the key to an excellent investment decision.
Of course, you might find a fantastic investment by looking at a few good candidates. So take a peek at this free list of companies with modest (or no) debt, trading on a P/E below 20.
If you spot an error that warrants correction, please contact the editor at editorial-team@simplywallst.com. This article by Simply Wall St is general in nature. It does not constitute a recommendation to buy or sell any stock, and does not take account of your objectives, or your financial situation. Simply Wall St has no position in the stocks mentioned.
We aim to bring you long-term focused research analysis driven by fundamental data. Note that our analysis may not factor in the latest price-sensitive company announcements or qualitative material. Thank you for reading.
