
 Yahoo Finance
 Should You Buy Transurban Group (ASX:TCL) For Its Dividend?

Dividend paying stocks like Transurban Group (ASX:TCL) tend to be popular with investors, and for good reason - some research suggests a significant amount of all stock market returns come from reinvested dividends. Unfortunately, it's common for investors to be enticed in by the seemingly attractive yield, and lose money when the company has to cut its dividend payments.
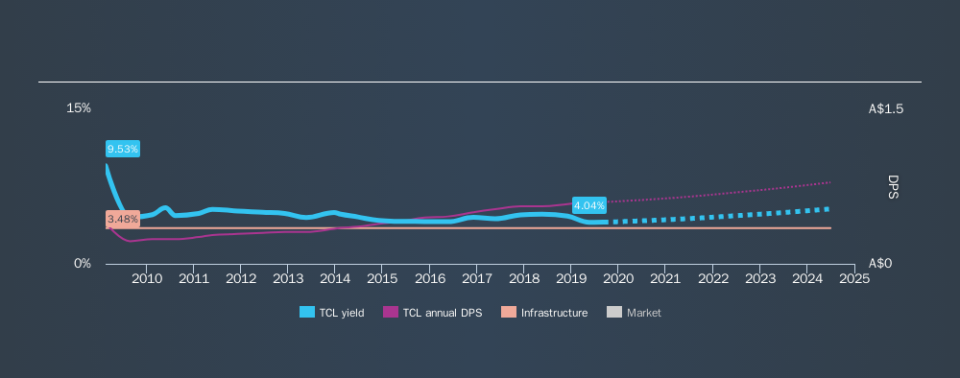
In this case, Transurban Group likely looks attractive to investors, given its 4.0% dividend yield and a payment history of over ten years. It would not be a surprise to discover that many investors buy it for the dividends. There are a few simple ways to reduce the risks of buying Transurban Group for its dividend, and we'll go through these below.
Explore this interactive chart for our latest analysis on Transurban Group!
Payout ratios
Dividends are typically paid from company earnings. If a company pays more in dividends than it earned, then the dividend might become unsustainable - hardly an ideal situation. As a result, we should always investigate whether a company can afford its dividend, measured as a percentage of a company's net income after tax. Looking at the data, we can see that 889% of Transurban Group's profits were paid out as dividends in the last 12 months. A payout ratio above 100% is definitely an item of concern, unless there are some other circumstances that would justify it.
In addition to comparing dividends against profits, we should inspect whether the company generated enough cash to pay its dividend. Last year, Transurban Group paid a dividend while reporting negative free cash flow. While there may be an explanation, we think this behaviour is generally not sustainable.
Is Transurban Group's Balance Sheet Risky?
As Transurban Group's dividend was not well covered by earnings, we need to check its balance sheet for signs of financial distress. A quick check of its financial situation can be done with two ratios: net debt divided by EBITDA (earnings before interest, tax, depreciation and amortisation), and net interest cover. Net debt to EBITDA measures total debt load relative to company earnings (lower = less debt), while net interest cover measures the ability to pay interest on the debt (higher = greater ability to pay interest costs). Transurban Group has net debt of 8.57 times its EBITDA, which implies meaningful risk if interest rates rise of earnings decline.
Net interest cover can be calculated by dividing earnings before interest and tax (EBIT) by the company's net interest expense. With EBIT of 1.36 times its interest expense, Transurban Group's interest cover is starting to look a bit thin. High debt and weak interest cover are not a great combo, and we would be cautious of relying on this company's dividend while these metrics persist.
Consider getting our latest analysis on Transurban Group's financial position here.
Dividend Volatility
One of the major risks of relying on dividend income, is the potential for a company to struggle financially and cut its dividend. Not only is your income cut, but the value of your investment declines as well - nasty. Transurban Group has been paying dividends for a long time, but for the purpose of this analysis, we only examine the past 10 years of payments. The dividend has been cut by more than 20% on at least one occasion historically. During the past ten-year period, the first annual payment was AU$0.40 in 2009, compared to AU$0.60 last year. This works out to be a compound annual growth rate (CAGR) of approximately 4.1% a year over that time. The dividends haven't grown at precisely 4.1% every year, but this is a useful way to average out the historical rate of growth.
Modest growth in the dividend is good to see, but we think this is offset by historical cuts to the payments. It is hard to live on a dividend income if the company's earnings are not consistent.
Dividend Growth Potential
With a relatively unstable dividend, it's even more important to see if earnings per share (EPS) are growing. Why take the risk of a dividend getting cut, unless there's a good chance of bigger dividends in future? Transurban Group's earnings per share have shrunk at 18% a year over the past five years. With this kind of significant decline, we always wonder what has changed in the business. Dividends are about stability, and Transurban Group's earnings per share, which support the dividend, have been anything but stable.
We'd also point out that Transurban Group issued a meaningful number of new shares in the past year. Trying to grow the dividend when issuing new shares reminds us of the ancient Greek tale of Sisyphus - perpetually pushing a boulder uphill. Companies that consistently issue new shares are often suboptimal from a dividend perspective.
Conclusion
To summarise, shareholders should always check that Transurban Group's dividends are affordable, that its dividend payments are relatively stable, and that it has decent prospects for growing its earnings and dividend. It's a concern to see that the company paid out such a high percentage of its earnings and cashflow as dividends. Unfortunately, the company has not been able to generate earnings per share growth, and cut its dividend at least once in the past. There are a few too many issues for us to get comfortable with Transurban Group from a dividend perspective. Businesses can change, but we would struggle to identify why an investor should rely on this stock for their income.
Without at least some growth in earnings per share over time, the dividend will eventually come under pressure either from costs or inflation. See if the 8 analysts are forecasting a turnaround in our free collection of analyst estimates here.
Looking for more high-yielding dividend ideas? Try our curated list of dividend stocks with a yield above 3%.
We aim to bring you long-term focused research analysis driven by fundamental data. Note that our analysis may not factor in the latest price-sensitive company announcements or qualitative material.
If you spot an error that warrants correction, please contact the editor at editorial-team@simplywallst.com. This article by Simply Wall St is general in nature. It does not constitute a recommendation to buy or sell any stock, and does not take account of your objectives, or your financial situation. Simply Wall St has no position in the stocks mentioned. Thank you for reading.
