
 Yahoo Finance
 Burlington Stores (BURL) Q3 Earnings Miss Mark, Sales Fall Y/Y
Burlington Stores, Inc. BURL reported dismal results for third-quarter fiscal 2022, wherein sales and earnings missed the Zacks Consensus Estimate, and compared unfavorably with the respective prior-fiscal year’s quarterly tallies. Margins were also soft in the reported fiscal quarter.
Quarterly performance was mainly hurt by a challenging and competitive environment. Higher inflationary pressures, and deleveraged supply-chain and buying costs weighed on BURL’s results for the reported fiscal quarter.
Despite the soft quarterly results, shares of this apparel retailer have rallied 20.5% during the trading hours on Nov 22. Over the past three months, the stock has decreased 25.6% against the industry's 2% growth. Management informed that since mid-October, it has been witnessing a pickup in the sales trend, continuing into November to date.
In addition, management is optimistic about the outlook for 2023 on five factors. These factors are greater consumer focus on value, lower levels of promotional activity with recovering sales trend, strong availability of great off-price merchandise, taking the right actions and a better expense environment in 2023, particularly for the contracted transportation rates. It expects the availability of great in-season merchandise to be pretty strong in 2023.
Insight Into the Headlines
Burlington Stores delivered adjusted earnings of 43 cents per share, lagging the Zacks Consensus Estimate of 52 cents. Also, the bottom line fell sharply from $1.36 a share recorded in the year-ago fiscal period.
Burlington Stores, Inc. Price, Consensus and EPS Surprise
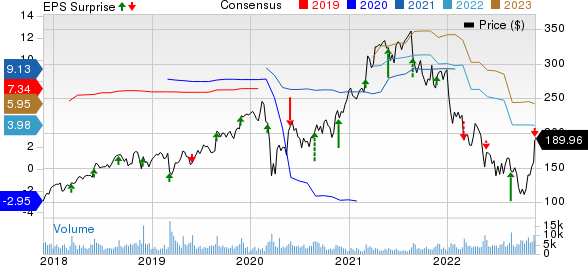
Burlington Stores, Inc. price-consensus-eps-surprise-chart | Burlington Stores, Inc. Quote
Total revenues of $2,040.7 million tumbled 11.4% from the last fiscal year’s quarterly reported figure. Net sales decreased 11.5% from the third-quarter fiscal 2021 number to $2,035.9 million, while Other revenues increased 9.1% to $4.8 million. The Zacks Consensus Estimate stood at $2,052 million for the reported quarter.
Comps dropped 17% from the year-ago fiscal quarter’s reading against a rise of 16% seen in the third quarter of fiscal 2021. BURL’s three-year geometric comp stack came in at a negative 3%.
Margins
Gross margin was 41.2% in the reported quarter, down 20 bps from the third-quarter fiscal 2021 actuals. Merchandise margins declined 90 bps, partly offsetting a 70-bps improvement in freight expenses. The decline in the merchandise margin was induced by aggressive markdowns.
Adjusted SG&A as a rate of sales was 26.7%, increasing 140 bps from the third-quarter fiscal 2021 actuals. Product sourcing costs included in SG&A came in at $178 million, up from $173 million recorded in the third quarter of fiscal 2021. Product sourcing costs represent the processing goods expenses via supply-chain and buying costs.
Adjusted EBITDA decreased 40% from the third-quarter fiscal 2021 tally to $123 million. As a rate of sales, the metric decreased 290 bps. Adjusted EBIT was $55 million, down from $140.3 million in third-quarter fiscal 2021. Adjusted EBIT margin fell 340 bps from the third-quarter fiscal 2021 finals.
Other Financial Aspects
This presently Zacks Rank #3 (Hold) Burlington Stores ended the reported quarter with cash and cash equivalents of $428.6 million, long-term debt of $1,464.6 million and a stockholders’ equity of $638.7 million. BURL exited the fiscal third quarter with $1,279 million of liquidity, including $429 million of unrestricted cash and $850 million available under its ABL facility.
Burlington Stores ended the quarter with $1,487 million of outstanding total debt comprising $949 million under its Term Loan Facility, $508 million of Convertible Notes and no borrowings under its ABL Facility.
Merchandise inventories were $1,445.1 million, up 41.5% from the third-quarter fiscal 2021 tally. Comparable store inventories grew 8% from the level recorded in the same quarter of fiscal 2021. Reserve inventory accounted for 31% of the total inventory at the end of the reported quarter.
Burlington Stores bought back 370,599 shares for $51 million under its share repurchase plan in the fiscal third quarter. As of Oct 29, 2022, BURL had $399 million remaining under the share repurchase authorization.
During the reported quarter, BURL inaugurated 16 net stores, taking the total store base to 893. This comprised 28 store openings, 10 relocations and two closings. For the fourth quarter of fiscal 2022, management intends to open an additional 39 stores and relocate five outlets, ending the fiscal year with 927 stores. It intends to open 87 net outlets in fiscal 2022.
For fiscal 2022, management projects capital expenditures, net of landlord allowances, of $510 million.
Outlook
For fiscal 2022, comps are likely to fall 14-15% compared with a decline of 13-15% predicted earlier and a 15% rise in fiscal 2021. This implies a three-year geometric comps stack of down 1-2% from the fiscal 2019 level.
Adjusted EBIT margin is now expected to decrease 370-400 bps for the full fiscal compared with a decline of 360-410 bps projected previously. Adjusted earnings per share are envisioned in the bracket of $3.77-$4.07 compared with the earlier view of $3.70-$4.30 and adjusted earnings per share of $8.41 recorded in the last fiscal year.
For the fiscal fourth quarter, comps are expected to decrease 6-9%, indicating a three-year geometric comps stack of down 1-4%. Adjusted EBIT margin is likely to be flat to up 70 bps from the last fiscal year’s quarterly reading, while adjusted earnings per share are forecast in the range of $2.45-$2.75. Burlington Stores’ adjusted earnings were $2.53 per share in the fourth-quarter fiscal 2021.
The Zacks Consensus Estimate for fourth-quarter and fiscal 2022 earnings is pegged at $2.58 and $3.98, respectively.
3 Top Retail Stocks
We highlighted three better-ranked stocks, namely Tecnoglass TGLS, GMS GMS and Wingstop WING.
Tecnoglass manufactures and sells architectural glass and windows, and aluminum products for the residential and commercial construction industries. TGLS currently sports a Zacks Rank #1 (Strong Buy). You can see the complete list of today’s Zacks #1 Rank stocks here.
The Zacks Consensus Estimate for Tecnoglass’ current financial-year sales and earnings per share suggests growth of 40.5% and 76.4%, respectively, from the corresponding year-ago reported figures. TGLS has a trailing four-quarter earnings surprise of 26.9%, on average.
GMS, a distributor of wallboard and suspended ceiling systems, currently flaunts a Zacks Rank of 1. GMS has a trailing four-quarter earnings surprise of 10.8%, on average.
The Zacks Consensus Estimate for GMS’ current financial-year sales and EPS suggests growth of 10.8% and 10.2%, respectively, from the corresponding year-ago reported figures. GMS has an expected EPS growth rate of 10.7% for three-five years.
Wingstop, which franchises and operates restaurants, is currently Zacks #1 Ranked. WING has a trailing four-quarter earnings surprise of 5.8%, on average.
The Zacks Consensus Estimate for Wingstop’s current financial-year sales and earnings per share suggests growth of 25.3% and 22.2%, respectively, from the corresponding year-ago reported numbers. WING has an expected EPS growth rate of 11% for three-five years.
Want the latest recommendations from Zacks Investment Research? Today, you can download 7 Best Stocks for the Next 30 Days. Click to get this free report
Burlington Stores, Inc. (BURL) : Free Stock Analysis Report
Tecnoglass Inc. (TGLS) : Free Stock Analysis Report
Wingstop Inc. (WING) : Free Stock Analysis Report
GMS Inc. (GMS) : Free Stock Analysis Report
