
 Yahoo Finance
 A Bullish Short-Term View on the Euro
The breakaway gap in the Euro (in this article, we use “Euro” to refer to the currency pair EUR/USD) on the 24th of April 2017 on the back of positive first round French election results that weekend broke through a resistance trendline from 2014, a 5-month ascending triangle and the 200-day moving average. It heralded a reversal in the trend of the Euro and what followed was a near 1-year rally that took the price from 1.087 to a high of 1.2558, a rise of 15.5%. It was only 100 pips away from testing a resistance trendline from 2008!
After consolidating in a symmetrical triangle, the Euro broke to the downside and has been falling for over a month now. The decline has been precipitated by an unwinding of one of the largest net long speculative positions in the history of the Euro, rising bond yields in the US attracting capital away from the EU and vast increases in the number of negative data surprises as shown by the Citi Euro Economic Surprise Index.
Currently, the Euro is on the ropes and as is often the case with trends and extended moves, analysts and market commentators are falling over themselves to forecast lower and lower target prices for the Euro.
After correctly calling the reversal in the dollar at the start of the year (the report can be found by clicking here) we are happy to again be on the other side of this boat and forecast that the Euro has found a bottom that should hold for a few weeks, if not months. Technically, the price found support on a trendline at the same time the Dollar Index (DXY) found major lateral resistance as detailed in our earlier report on the Dollar. Where the bounce ends will be very telling if the rising trend that began in the Euro in 2017 will continue or if Euro and Dollar parity is on the cards next year. In any case, the bounce may be good for a solid trade that should last at least a few weeks in our view.
The Technical Picture
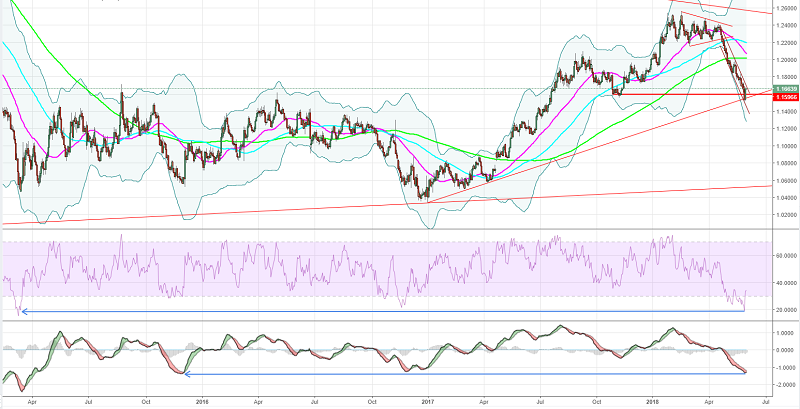
The Euro has been confined to a narrow, falling channel since breaking a symmetrical triangle to the downside in late April of this year. The fall has taken it to a new low for the year and it is down about 2.5% YTD. However, the price recently experienced a trend-ending downwards spike on the back of political developments out of Italy. The price ran stops on a trendline from the end of 2017 lows but managed to close on it. It had a huge reversal the next day.
The spike downwards and the subsequent reversal constitutes a false downside break of lateral support at the 1.16 level. False downside breaks are reliably bullish signals, as is the close on the trendline.
Looking at momentum indicators, the PMO (Price Momentum Oscillator) is at its lowest level since the end of 2015. The false downside break has already caused the signal line to inflect and trend upwards. A further rise in the price will be confirmed by a bullish crossover in the PMO (the PMO is a lagging indicator).
The RSI (Relative Strength Index) was recently at its lowest level since the start of 2015. The trend-ending spike downwards pushed the RSI into a deeply oversold territory. The subsequent reversal in the price was accompanied by a reversal in the RSI as well. The RSI has now made a higher high while the price has not. This is the first sign that a reversal in the price trend is on the cards.
While there still exists a non-trivial risk that the price will make a new low before bottoming (as the price usually bottoms after the RSI does), the sharp, trend-ending spike and subsequent false downside break confirmation greatly reduce that risk in this instance.
The last time both the PMO and RSI were at such depressed levels, the price rallied substantially in the weeks that followed.
Drilling down to a 1-hour chart, we can see the falling channel the price is currently in more clearly. However, we can also see that the price has now formed a head & shoulders bottom.
The price has recently broken above the neckline which validates the pattern. A target price projection from the completed head and shoulders bottom is roughly 1.177. as it occurred in the past days, the price will break out of the falling channel which is the most important development that needs to happen to confirm a bottom and start a bounce.
A rise out of the falling channel and above 1.17 (EUR/USD is trading at 1.1816 at the time of writing), the figure is where we may look to start establishing some long positions.

Our Outlook
As mentioned above, we believe that a bottom for the price that will last for a few weeks, or even months, may now be in place. Our belief is based on the price holding a longer-term trendline, confirming a false downside break of important lateral resistance, very oversold momentum indicators in the form of the PMO and RSI and a head & shoulders bottom on the 1-hour chart.
We may look to establish long positions as the pair is above 1.17. This is a clear ‘big figure’ resistance and breaks out of a falling channel that has been in place for over a month.
The first target for the bounce is the 38.2 Fibonacci level from the late April drop just under 1.186. Further up, resistance will come from the 50 and 61.8 Fibonacci levels, as well as the 50- and 200- day moving averages, with major resistance just under 1.21. This is where we may take profits on our long positions. We may use any decent pullbacks along the way to add to positions.

Expressing your view
Whether you agree with our analysis above or not, there is no better FX broker to express your bullish or bearish view on the Euro through than Rakuten Securities Australia. With our new 400:1 leverage account launching June 4th, this means minimal capital allocation is needed to make a big profit on any moves in the Euro. What’s more, our tight, fixed spreads (for 95% of market hours) means that you can trade with certainty and confidence. The ultra-low trading costs mean more money in your pocket!
This article was originally posted on FX Empire
