
 Yahoo Finance
 Is BT Group plc's (LON:BT.A) P/E Ratio Really That Good?

This article is written for those who want to get better at using price to earnings ratios (P/E ratios). We'll look at BT Group plc's (LON:BT.A) P/E ratio and reflect on what it tells us about the company's share price. BT Group has a P/E ratio of 10.05, based on the last twelve months. In other words, at today's prices, investors are paying £10.05 for every £1 in prior year profit.
See our latest analysis for BT Group
How Do I Calculate BT Group's Price To Earnings Ratio?
The formula for P/E is:
Price to Earnings Ratio = Share Price ÷ Earnings per Share (EPS)
Or for BT Group:
P/E of 10.05 = £2.3 ÷ £0.23 (Based on the trailing twelve months to December 2018.)
Is A High Price-to-Earnings Ratio Good?
A higher P/E ratio means that investors are paying a higher price for each £1 of company earnings. That isn't necessarily good or bad, but a high P/E implies relatively high expectations of what a company can achieve in the future.
How Growth Rates Impact P/E Ratios
When earnings fall, the 'E' decreases, over time. That means even if the current P/E is low, it will increase over time if the share price stays flat. So while a stock may look cheap based on past earnings, it could be expensive based on future earnings.
It's nice to see that BT Group grew EPS by a stonking 45% in the last year. In contrast, EPS has decreased by 2.2%, annually, over 5 years.
Does BT Group Have A Relatively High Or Low P/E For Its Industry?
The P/E ratio indicates whether the market has higher or lower expectations of a company. We can see in the image below that the average P/E (20.5) for companies in the telecom industry is higher than BT Group's P/E.
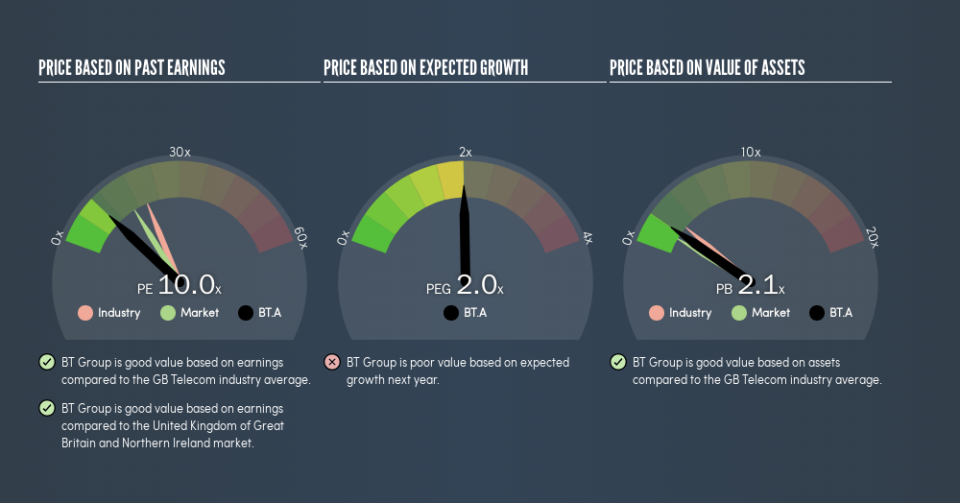
Its relatively low P/E ratio indicates that BT Group shareholders think it will struggle to do as well as other companies in its industry classification. Since the market seems unimpressed with BT Group, it's quite possible it could surprise on the upside. You should delve deeper. I like to check if company insiders have been buying or selling.
Remember: P/E Ratios Don't Consider The Balance Sheet
Don't forget that the P/E ratio considers market capitalization. That means it doesn't take debt or cash into account. Theoretically, a business can improve its earnings (and produce a lower P/E in the future) by investing in growth. That means taking on debt (or spending its cash).
Spending on growth might be good or bad a few years later, but the point is that the P/E ratio does not account for the option (or lack thereof).
So What Does BT Group's Balance Sheet Tell Us?
Net debt totals 59% of BT Group's market cap. This is a reasonably significant level of debt -- all else being equal you'd expect a much lower P/E than if it had net cash.
The Bottom Line On BT Group's P/E Ratio
BT Group's P/E is 10 which is below average (16.4) in the GB market. The company may have significant debt, but EPS growth was good last year. If the company can continue to grow earnings, then the current P/E may be unjustifiably low.
Investors should be looking to buy stocks that the market is wrong about. If the reality for a company is not as bad as the P/E ratio indicates, then the share price should increase as the market realizes this. So this free visual report on analyst forecasts could hold the key to an excellent investment decision.
Of course, you might find a fantastic investment by looking at a few good candidates. So take a peek at this free list of companies with modest (or no) debt, trading on a P/E below 20.
We aim to bring you long-term focused research analysis driven by fundamental data. Note that our analysis may not factor in the latest price-sensitive company announcements or qualitative material.
If you spot an error that warrants correction, please contact the editor at editorial-team@simplywallst.com. This article by Simply Wall St is general in nature. It does not constitute a recommendation to buy or sell any stock, and does not take account of your objectives, or your financial situation. Simply Wall St has no position in the stocks mentioned. Thank you for reading.
