
 Yahoo Finance
 Should BT Group plc (LON:BT.A) Be Part Of Your Portfolio?

Want to participate in a research study? Help shape the future of investing tools and earn a $60 gift card!
A large part of investment returns can be generated by dividend-paying stock given their role in compounding returns over time. Historically, BT Group plc (LON:BT.A) has paid a dividend to shareholders. It currently yields 6.9%. Let's dig deeper into whether BT Group should have a place in your portfolio.
Check out our latest analysis for BT Group
5 questions I ask before picking a dividend stock
If you are a dividend investor, you should always assess these five key metrics:
Is their annual yield among the top 25% of dividend payers?
Has its dividend been stable over the past (i.e. no missed payments or significant payout cuts)?
Has it increased its dividend per share amount over the past?
Does earnings amply cover its dividend payments?
Will it have the ability to keep paying its dividends going forward?
How does BT Group fare?
BT Group has a trailing twelve-month payout ratio of 66%, which means that the dividend is covered by earnings. However, going forward, analysts expect BT.A's payout to fall to 55% of its earnings. Assuming a constant share price, this equates to a dividend yield of around 6.7%. In addition to this, EPS is also forecasted to fall to £0.22 in the upcoming year. The lower EPS on top of a lower payout ratio will lead to a fall in dividend payment moving forward.
When assessing the forecast sustainability of a dividend it is also worth considering the cash flow of the business. Cash flow is important because companies with strong cash flow can usually sustain higher payout ratios.
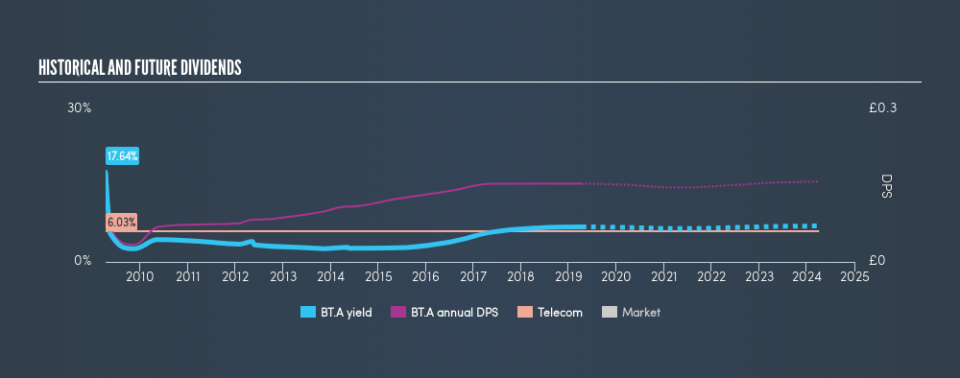
If there's one type of stock you want to be reliable, it's dividend stocks and their stable income-generating ability. Dividend payments from BT Group have been volatile in the past 10 years, with some years experiencing significant drops of over 25%. This means that dividend hunters should probably steer clear of the stock, at least for now until the track record improves.
In terms of its peers, BT Group generates a yield of 6.9%, which is high for Telecom stocks.
Next Steps:
With this in mind, I definitely rank BT Group as a strong dividend stock, and makes it worth further research for anyone who likes steady income generation from their portfolio. Given that this is purely a dividend analysis, I urge potential investors to try and get a good understanding of the underlying business and its fundamentals before deciding on an investment. There are three important aspects you should look at:
Future Outlook: What are well-informed industry analysts predicting for BT.A’s future growth? Take a look at our free research report of analyst consensus for BT.A’s outlook.
Valuation: What is BT.A worth today? Even if the stock is a cash cow, it's not worth an infinite price. The intrinsic value infographic in our free research report helps visualize whether BT.A is currently mispriced by the market.
Other Dividend Rockstars: Are there better dividend payers with stronger fundamentals out there? Check out our free list of these great stocks here.
We aim to bring you long-term focused research analysis driven by fundamental data. Note that our analysis may not factor in the latest price-sensitive company announcements or qualitative material.
If you spot an error that warrants correction, please contact the editor at editorial-team@simplywallst.com. This article by Simply Wall St is general in nature. It does not constitute a recommendation to buy or sell any stock, and does not take account of your objectives, or your financial situation. Simply Wall St has no position in the stocks mentioned. Thank you for reading.
