
 Yahoo Finance
 Brunswick's (NYSE:BC) five-year earnings growth trails the 15% YoY shareholder returns
If you want to compound wealth in the stock market, you can do so by buying an index fund. But in our experience, buying the right stocks can give your wealth a significant boost. For example, the Brunswick Corporation (NYSE:BC) share price is up 83% in the last five years, slightly above the market return. It's also good to see that the stock is up 17% in a year.
The past week has proven to be lucrative for Brunswick investors, so let's see if fundamentals drove the company's five-year performance.
See our latest analysis for Brunswick
In his essay The Superinvestors of Graham-and-Doddsville Warren Buffett described how share prices do not always rationally reflect the value of a business. One flawed but reasonable way to assess how sentiment around a company has changed is to compare the earnings per share (EPS) with the share price.
During five years of share price growth, Brunswick achieved compound earnings per share (EPS) growth of 17% per year. The EPS growth is more impressive than the yearly share price gain of 13% over the same period. So it seems the market isn't so enthusiastic about the stock these days.
The company's earnings per share (over time) is depicted in the image below (click to see the exact numbers).
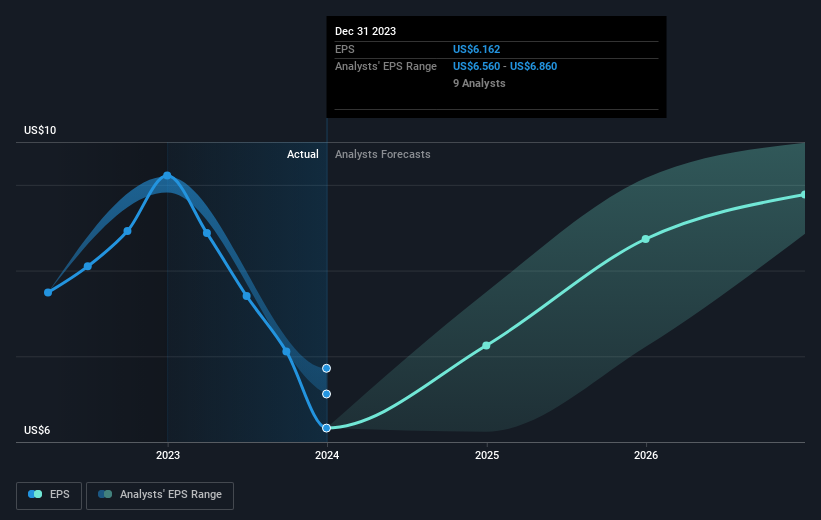
Dive deeper into Brunswick's key metrics by checking this interactive graph of Brunswick's earnings, revenue and cash flow.
What About Dividends?
As well as measuring the share price return, investors should also consider the total shareholder return (TSR). The TSR is a return calculation that accounts for the value of cash dividends (assuming that any dividend received was reinvested) and the calculated value of any discounted capital raisings and spin-offs. It's fair to say that the TSR gives a more complete picture for stocks that pay a dividend. We note that for Brunswick the TSR over the last 5 years was 100%, which is better than the share price return mentioned above. This is largely a result of its dividend payments!
A Different Perspective
Brunswick provided a TSR of 19% over the last twelve months. But that return falls short of the market. The silver lining is that the gain was actually better than the average annual return of 15% per year over five year. This could indicate that the company is winning over new investors, as it pursues its strategy. I find it very interesting to look at share price over the long term as a proxy for business performance. But to truly gain insight, we need to consider other information, too. Consider for instance, the ever-present spectre of investment risk. We've identified 3 warning signs with Brunswick , and understanding them should be part of your investment process.
We will like Brunswick better if we see some big insider buys. While we wait, check out this free list of growing companies with considerable, recent, insider buying.
Please note, the market returns quoted in this article reflect the market weighted average returns of stocks that currently trade on American exchanges.
Have feedback on this article? Concerned about the content? Get in touch with us directly. Alternatively, email editorial-team (at) simplywallst.com.
This article by Simply Wall St is general in nature. We provide commentary based on historical data and analyst forecasts only using an unbiased methodology and our articles are not intended to be financial advice. It does not constitute a recommendation to buy or sell any stock, and does not take account of your objectives, or your financial situation. We aim to bring you long-term focused analysis driven by fundamental data. Note that our analysis may not factor in the latest price-sensitive company announcements or qualitative material. Simply Wall St has no position in any stocks mentioned.
