
 Yahoo Finance
 Brookside Energy (ASX:BRK) Might Be Having Difficulty Using Its Capital Effectively
What trends should we look for it we want to identify stocks that can multiply in value over the long term? Firstly, we'd want to identify a growing return on capital employed (ROCE) and then alongside that, an ever-increasing base of capital employed. Ultimately, this demonstrates that it's a business that is reinvesting profits at increasing rates of return. In light of that, when we looked at Brookside Energy (ASX:BRK) and its ROCE trend, we weren't exactly thrilled.
Return On Capital Employed (ROCE): What Is It?
If you haven't worked with ROCE before, it measures the 'return' (pre-tax profit) a company generates from capital employed in its business. Analysts use this formula to calculate it for Brookside Energy:
Return on Capital Employed = Earnings Before Interest and Tax (EBIT) ÷ (Total Assets - Current Liabilities)
0.081 = AU$4.8m ÷ (AU$81m - AU$21m) (Based on the trailing twelve months to June 2022).
So, Brookside Energy has an ROCE of 8.1%. Ultimately, that's a low return and it under-performs the Oil and Gas industry average of 13%.
Check out our latest analysis for Brookside Energy
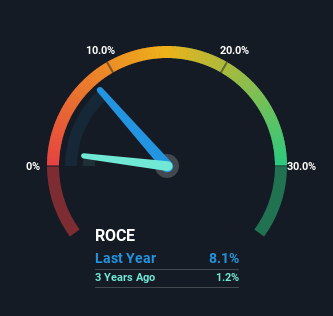
Historical performance is a great place to start when researching a stock so above you can see the gauge for Brookside Energy's ROCE against it's prior returns. If you want to delve into the historical earnings, revenue and cash flow of Brookside Energy, check out these free graphs here.
The Trend Of ROCE
On the surface, the trend of ROCE at Brookside Energy doesn't inspire confidence. Around five years ago the returns on capital were 20%, but since then they've fallen to 8.1%. However, given capital employed and revenue have both increased it appears that the business is currently pursuing growth, at the consequence of short term returns. If these investments prove successful, this can bode very well for long term stock performance.
On a side note, Brookside Energy's current liabilities have increased over the last five years to 26% of total assets, effectively distorting the ROCE to some degree. If current liabilities hadn't increased as much as they did, the ROCE could actually be even lower. While the ratio isn't currently too high, it's worth keeping an eye on this because if it gets particularly high, the business could then face some new elements of risk.
The Bottom Line
In summary, despite lower returns in the short term, we're encouraged to see that Brookside Energy is reinvesting for growth and has higher sales as a result.
Brookside Energy does come with some risks though, we found 4 warning signs in our investment analysis, and 2 of those are a bit concerning...
If you want to search for solid companies with great earnings, check out this free list of companies with good balance sheets and impressive returns on equity.
Have feedback on this article? Concerned about the content? Get in touch with us directly. Alternatively, email editorial-team (at) simplywallst.com.
This article by Simply Wall St is general in nature. We provide commentary based on historical data and analyst forecasts only using an unbiased methodology and our articles are not intended to be financial advice. It does not constitute a recommendation to buy or sell any stock, and does not take account of your objectives, or your financial situation. We aim to bring you long-term focused analysis driven by fundamental data. Note that our analysis may not factor in the latest price-sensitive company announcements or qualitative material. Simply Wall St has no position in any stocks mentioned.
Join A Paid User Research Session
You’ll receive a US$30 Amazon Gift card for 1 hour of your time while helping us build better investing tools for the individual investors like yourself. Sign up here
