
 Yahoo Finance
 Brisbane Broncos' (ASX:BBL) investors will be pleased with their strong 115% return over the last three years
Brisbane Broncos Limited (ASX:BBL) shareholders have seen the share price descend 11% over the month. But in three years the returns have been great. In fact, the share price is up a full 107% compared to three years ago. After a run like that some may not be surprised to see prices moderate. The thing to consider is whether the underlying business is doing well enough to support the current price.
So let's assess the underlying fundamentals over the last 3 years and see if they've moved in lock-step with shareholder returns.
See our latest analysis for Brisbane Broncos
While markets are a powerful pricing mechanism, share prices reflect investor sentiment, not just underlying business performance. One imperfect but simple way to consider how the market perception of a company has shifted is to compare the change in the earnings per share (EPS) with the share price movement.
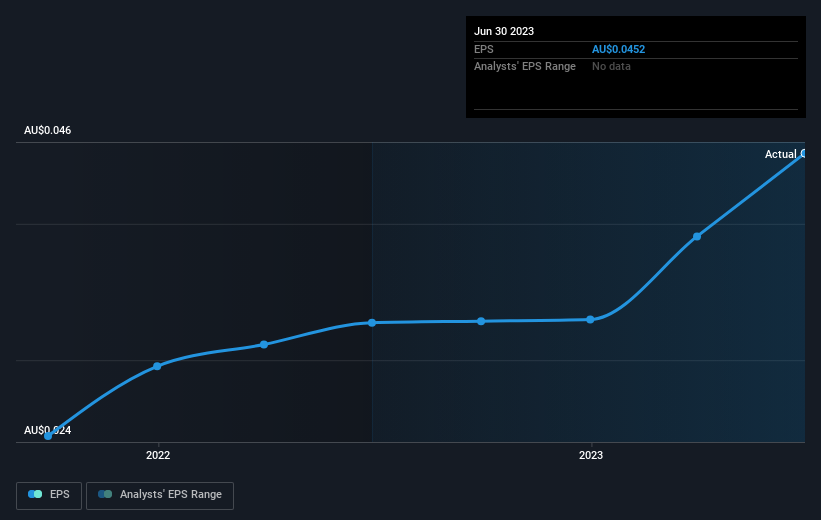
During three years of share price growth, Brisbane Broncos achieved compound earnings per share growth of 49% per year. This EPS growth is higher than the 27% average annual increase in the share price. So it seems investors have become more cautious about the company, over time.
The image below shows how EPS has tracked over time (if you click on the image you can see greater detail).
This free interactive report on Brisbane Broncos' earnings, revenue and cash flow is a great place to start, if you want to investigate the stock further.
What About Dividends?
As well as measuring the share price return, investors should also consider the total shareholder return (TSR). Whereas the share price return only reflects the change in the share price, the TSR includes the value of dividends (assuming they were reinvested) and the benefit of any discounted capital raising or spin-off. So for companies that pay a generous dividend, the TSR is often a lot higher than the share price return. As it happens, Brisbane Broncos' TSR for the last 3 years was 115%, which exceeds the share price return mentioned earlier. And there's no prize for guessing that the dividend payments largely explain the divergence!
A Different Perspective
Brisbane Broncos shareholders are down 19% for the year (even including dividends), but the market itself is up 7.1%. However, keep in mind that even the best stocks will sometimes underperform the market over a twelve month period. On the bright side, long term shareholders have made money, with a gain of 14% per year over half a decade. If the fundamental data continues to indicate long term sustainable growth, the current sell-off could be an opportunity worth considering. While it is well worth considering the different impacts that market conditions can have on the share price, there are other factors that are even more important. Case in point: We've spotted 1 warning sign for Brisbane Broncos you should be aware of.
For those who like to find winning investments this free list of growing companies with recent insider purchasing, could be just the ticket.
Please note, the market returns quoted in this article reflect the market weighted average returns of stocks that currently trade on Australian exchanges.
Have feedback on this article? Concerned about the content? Get in touch with us directly. Alternatively, email editorial-team (at) simplywallst.com.
This article by Simply Wall St is general in nature. We provide commentary based on historical data and analyst forecasts only using an unbiased methodology and our articles are not intended to be financial advice. It does not constitute a recommendation to buy or sell any stock, and does not take account of your objectives, or your financial situation. We aim to bring you long-term focused analysis driven by fundamental data. Note that our analysis may not factor in the latest price-sensitive company announcements or qualitative material. Simply Wall St has no position in any stocks mentioned.
