
 Yahoo Finance
 Breakeven Is Near for Ebiquity plc (LON:EBQ)
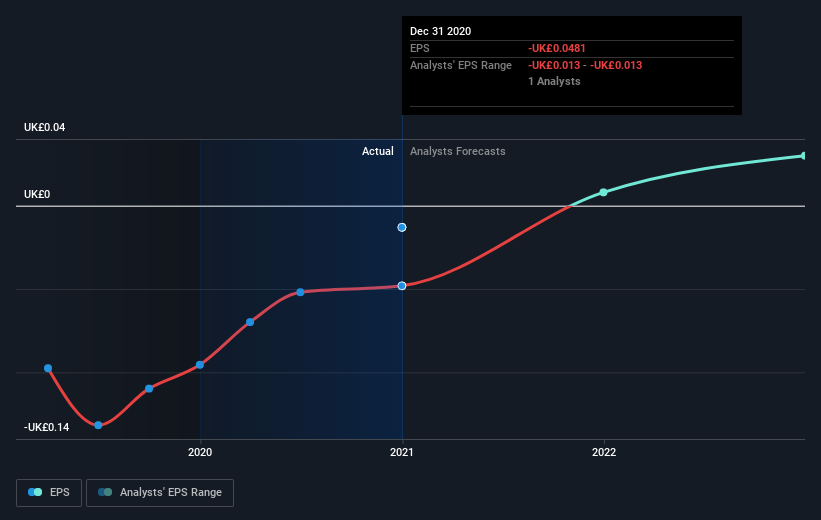
We feel now is a pretty good time to analyse Ebiquity plc's (LON:EBQ) business as it appears the company may be on the cusp of a considerable accomplishment. Ebiquity plc, together with its subsidiaries, provides media consultancy and investment analysis services worldwide. On 31 December 2020, the UK£46m market-cap company posted a loss of UK£3.9m for its most recent financial year. Many investors are wondering about the rate at which Ebiquity will turn a profit, with the big question being “when will the company breakeven?” We've put together a brief outline of industry analyst expectations for the company, its year of breakeven and its implied growth rate.
See our latest analysis for Ebiquity
Consensus from 2 of the British Media analysts is that Ebiquity is on the verge of breakeven. They expect the company to post a final loss in 2020, before turning a profit of UK£652k in 2021. So, the company is predicted to breakeven approximately a year from now or less! At what rate will the company have to grow in order to realise the consensus estimates forecasting breakeven in under 12 months? Using a line of best fit, we calculated an average annual growth rate of 136%, which signals high confidence from analysts. If this rate turns out to be too aggressive, the company may become profitable much later than analysts predict.
We're not going to go through company-specific developments for Ebiquity given that this is a high-level summary, however, take into account that by and large a high forecast growth rate is not unusual for a company that is currently undergoing an investment period.
Before we wrap up, there’s one issue worth mentioning. Ebiquity currently has a relatively high level of debt. Generally, the rule of thumb is debt shouldn’t exceed 40% of your equity, which in Ebiquity's case is 64%. Note that a higher debt obligation increases the risk around investing in the loss-making company.
Next Steps:
This article is not intended to be a comprehensive analysis on Ebiquity, so if you are interested in understanding the company at a deeper level, take a look at Ebiquity's company page on Simply Wall St. We've also compiled a list of essential factors you should look at:
Valuation: What is Ebiquity worth today? Has the future growth potential already been factored into the price? The intrinsic value infographic in our free research report helps visualize whether Ebiquity is currently mispriced by the market.
Management Team: An experienced management team on the helm increases our confidence in the business – take a look at who sits on Ebiquity’s board and the CEO’s background.
Other High-Performing Stocks: Are there other stocks that provide better prospects with proven track records? Explore our free list of these great stocks here.
This article by Simply Wall St is general in nature. We provide commentary based on historical data and analyst forecasts only using an unbiased methodology and our articles are not intended to be financial advice. It does not constitute a recommendation to buy or sell any stock, and does not take account of your objectives, or your financial situation. We aim to bring you long-term focused analysis driven by fundamental data. Note that our analysis may not factor in the latest price-sensitive company announcements or qualitative material. Simply Wall St has no position in any stocks mentioned.
Have feedback on this article? Concerned about the content? Get in touch with us directly. Alternatively, email editorial-team (at) simplywallst.com.
