
 Yahoo Finance
 Breakeven On The Horizon For Valaris Limited (NYSE:VAL)
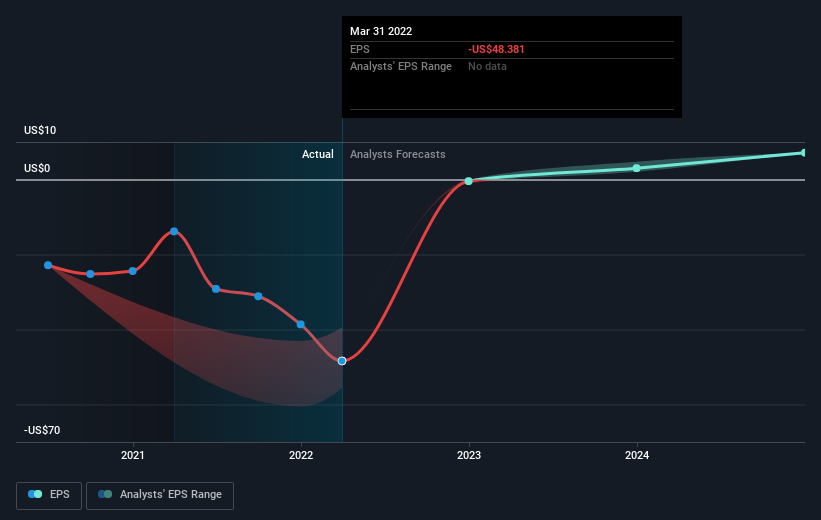
With the business potentially at an important milestone, we thought we'd take a closer look at Valaris Limited's (NYSE:VAL) future prospects. Valaris Limited offers offshore contract drilling services to oil and gas industry in Bermuda and internationally. The US$4.3b market-cap company posted a loss in its most recent financial year of US$4.5b and a latest trailing-twelve-month loss of US$3.6b shrinking the gap between loss and breakeven. Many investors are wondering about the rate at which Valaris will turn a profit, with the big question being “when will the company breakeven?” Below we will provide a high-level summary of the industry analysts’ expectations for the company.
Check out our latest analysis for Valaris
Consensus from 5 of the American Energy Services analysts is that Valaris is on the verge of breakeven. They anticipate the company to incur a final loss in 2022, before generating positive profits of US$227m in 2023. The company is therefore projected to breakeven just over a year from today. What rate will the company have to grow year-on-year in order to breakeven on this date? Using a line of best fit, we calculated an average annual growth rate of 73%, which signals high confidence from analysts. If this rate turns out to be too aggressive, the company may become profitable much later than analysts predict.
We're not going to go through company-specific developments for Valaris given that this is a high-level summary, but, bear in mind that typically energy companies, depending on the stage of operation and resource produced, have irregular periods of cash flow. So, a high growth rate is not out of the ordinary, particularly when a company is in a period of investment.
One thing we would like to bring into light with Valaris is its relatively high level of debt. Typically, debt shouldn’t exceed 40% of your equity, which in Valaris' case is 53%. A higher level of debt requires more stringent capital management which increases the risk in investing in the loss-making company.
Next Steps:
There are too many aspects of Valaris to cover in one brief article, but the key fundamentals for the company can all be found in one place – Valaris' company page on Simply Wall St. We've also put together a list of pertinent aspects you should look at:
Valuation: What is Valaris worth today? Has the future growth potential already been factored into the price? The intrinsic value infographic in our free research report helps visualize whether Valaris is currently mispriced by the market.
Management Team: An experienced management team on the helm increases our confidence in the business – take a look at who sits on Valaris’s board and the CEO’s background.
Other High-Performing Stocks: Are there other stocks that provide better prospects with proven track records? Explore our free list of these great stocks here.
Have feedback on this article? Concerned about the content? Get in touch with us directly. Alternatively, email editorial-team (at) simplywallst.com.
This article by Simply Wall St is general in nature. We provide commentary based on historical data and analyst forecasts only using an unbiased methodology and our articles are not intended to be financial advice. It does not constitute a recommendation to buy or sell any stock, and does not take account of your objectives, or your financial situation. We aim to bring you long-term focused analysis driven by fundamental data. Note that our analysis may not factor in the latest price-sensitive company announcements or qualitative material. Simply Wall St has no position in any stocks mentioned.
