
 Yahoo Finance
 Boston Properties (BXP) Trumps Q3 FFO & Revenue Estimates
Boston Properties Inc.’s BXP third-quarter 2019 funds from operations (FFO) per share of $1.64 surpassed the Zacks Consensus Estimate of $1.62. Nonetheless, the reported tally remained flat year over year.
Higher occupancy buoyed the company’s results in the quarter. Further, total revenues witnessed 8% year-over-year growth.
Revenues from lease came in at $692.23 million, outpacing the Zacks Consensus Estimate of $680.7 million. The reported tally also improved roughly 1.7% from the prior quarter’s tally of around $680.2 million.
Property Update
As of Sep 30, 2019, Boston Properties’ portfolio comprised 196 properties, covering a total of around 51.9 million square feet of space. This included 13 under-construction properties.
Total portfolio occupancy for the company’s in-service office properties was 92.6% as of Sep 30, 2019, indicating a year-over-year expansion of 150 basis points.
During the September-end quarter, Boston Properties purchased 880 and 890 Winter Street in Waltham, MA for $106 million. The 880 and 890 Winter Street comprises two Class A office properties, spanning around 392,000 square feet of space, and is 82% leased.
Liquidity
Boston Properties exited the third quarter with cash and cash equivalents of $751.2 million, up from $543.3 million as of Dec 31, 2018.
Outlook
The company has provided its fourth-quarter 2019 FFO per share guidance of $1.84-$1.86. The Zacks Consensus Estimate is pegged at $1.82.
For full-year 2019, Boston Properties has revised its FFO per share guidance to $6.98-$7. The Zacks Consensus Estimate for 2019 FFO per share is $6.95.
Moreover, for 2020, the company provided preliminary FFO per share guidance of $7.45-$7.65. This indicates 8% year-over-year growth at the mid-point, relative to the 2019 projections. The Zacks Consensus Estimate for 2019 FFO per share is $7.48.
Our Viewpoint
During the quarter, Boston Properties partially placed in service several development projects. This included The Hub on Causeway – Residential. The 320,000-square-foot residential property comprises 440 units and is situated in Boston, MA. These development projects will likely contribute to the company’s top-line growth in the upcoming quarters, and hence are encouraging.
Boston Properties, Inc. Price, Consensus and EPS Surprise
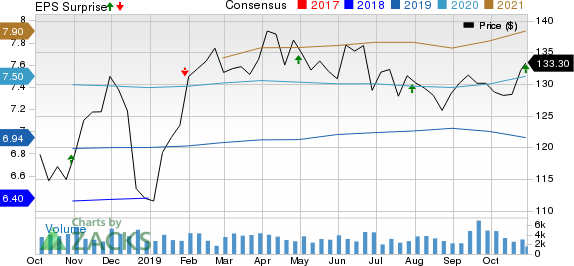
Boston Properties, Inc. price-consensus-eps-surprise-chart | Boston Properties, Inc. Quote
Boston Properties currently carries a Zacks Rank #2 (Buy). You can see the complete list of today’s Zacks #1 Rank (Strong Buy) stocks here.
Performance of Other REITs
Highwoods Properties Inc.’s HIW third-quarter FFO per share of 88 cents surpassed the Zacks Consensus Estimate of 85 cents. The reported tally excluded the net impact of 5 cents relating to the company’s market rotation plan. The figure also improved 2.3% year over year.
Cousins Properties Incorporated CUZ reported third-quarter 2019 FFO per share (before TIER transaction costs) of 72 cents, outpacing the Zacks Consensus Estimate of 69 cents. Further, the figure came in higher than the prior-year quarter’s reported tally of 63 cents.
Ventas, Inc. VTR delivered third-quarter 2019 normalized FFO per share of 96 cents, beating the Zacks Consensus Estimate of 94 cents. However, the figure came in lower than the year-ago tally of 99 cents.
Note: Anything related to earnings presented in this write-up represent funds from operations (FFO) — a widely used metric to gauge the performance of REITs.
Today's Best Stocks from Zacks
Would you like to see the updated picks from our best market-beating strategies? From 2017 through 2018, while the S&P 500 gained +15.8%, five of our screens returned +38.0%, +61.3%, +61.6%, +68.1%, and +98.3%.
This outperformance has not just been a recent phenomenon. From 2000 – 2018, while the S&P averaged +4.8% per year, our top strategies averaged up to +56.2% per year.
See their latest picks free >>
Want the latest recommendations from Zacks Investment Research? Today, you can download 7 Best Stocks for the Next 30 Days. Click to get this free report
Highwoods Properties, Inc. (HIW) : Free Stock Analysis Report
Cousins Properties Incorporated (CUZ) : Free Stock Analysis Report
Ventas, Inc. (VTR) : Free Stock Analysis Report
Boston Properties, Inc. (BXP) : Free Stock Analysis Report
To read this article on Zacks.com click here.
Zacks Investment Research
