
 Yahoo Finance
 Bodycote (LON:BOY) shareholders have endured a 19% loss from investing in the stock five years ago
While it may not be enough for some shareholders, we think it is good to see the Bodycote plc (LON:BOY) share price up 10% in a single quarter. But if you look at the last five years the returns have not been good. After all, the share price is down 33% in that time, significantly under-performing the market.
Now let's have a look at the company's fundamentals, and see if the long term shareholder return has matched the performance of the underlying business.
Check out our latest analysis for Bodycote
There is no denying that markets are sometimes efficient, but prices do not always reflect underlying business performance. One way to examine how market sentiment has changed over time is to look at the interaction between a company's share price and its earnings per share (EPS).
During the five years over which the share price declined, Bodycote's earnings per share (EPS) dropped by 4.8% each year. This reduction in EPS is less than the 8% annual reduction in the share price. This implies that the market is more cautious about the business these days.
The graphic below depicts how EPS has changed over time (unveil the exact values by clicking on the image).
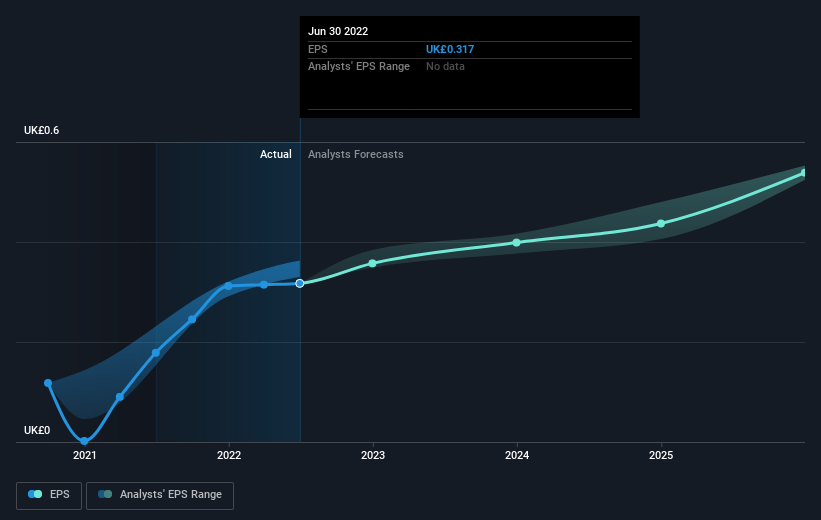
We know that Bodycote has improved its bottom line lately, but is it going to grow revenue? If you're interested, you could check this free report showing consensus revenue forecasts.
What About Dividends?
As well as measuring the share price return, investors should also consider the total shareholder return (TSR). Whereas the share price return only reflects the change in the share price, the TSR includes the value of dividends (assuming they were reinvested) and the benefit of any discounted capital raising or spin-off. It's fair to say that the TSR gives a more complete picture for stocks that pay a dividend. In the case of Bodycote, it has a TSR of -19% for the last 5 years. That exceeds its share price return that we previously mentioned. And there's no prize for guessing that the dividend payments largely explain the divergence!
A Different Perspective
While the broader market lost about 2.9% in the twelve months, Bodycote shareholders did even worse, losing 11% (even including dividends). Having said that, it's inevitable that some stocks will be oversold in a falling market. The key is to keep your eyes on the fundamental developments. Regrettably, last year's performance caps off a bad run, with the shareholders facing a total loss of 4% per year over five years. We realise that Baron Rothschild has said investors should "buy when there is blood on the streets", but we caution that investors should first be sure they are buying a high quality business. It's always interesting to track share price performance over the longer term. But to understand Bodycote better, we need to consider many other factors. Case in point: We've spotted 1 warning sign for Bodycote you should be aware of.
Of course, you might find a fantastic investment by looking elsewhere. So take a peek at this free list of companies we expect will grow earnings.
Please note, the market returns quoted in this article reflect the market weighted average returns of stocks that currently trade on British exchanges.
Have feedback on this article? Concerned about the content? Get in touch with us directly. Alternatively, email editorial-team (at) simplywallst.com.
This article by Simply Wall St is general in nature. We provide commentary based on historical data and analyst forecasts only using an unbiased methodology and our articles are not intended to be financial advice. It does not constitute a recommendation to buy or sell any stock, and does not take account of your objectives, or your financial situation. We aim to bring you long-term focused analysis driven by fundamental data. Note that our analysis may not factor in the latest price-sensitive company announcements or qualitative material. Simply Wall St has no position in any stocks mentioned.
Join A Paid User Research Session
You’ll receive a US$30 Amazon Gift card for 1 hour of your time while helping us build better investing tools for the individual investors like yourself. Sign up here
