
 Yahoo Finance
 How Boadicea Resources Ltd (ASX:BOA) Can Impact Your Portfolio Volatility

Anyone researching Boadicea Resources Ltd (ASX:BOA) might want to consider the historical volatility of the share price. Volatility is considered to be a measure of risk in modern finance theory. Investors may think of volatility as falling into two main categories. The first type is company specific volatility. Investors use diversification across uncorrelated stocks to reduce this kind of price volatility across the portfolio. The second sort is caused by the natural volatility of markets, overall. For example, certain macroeconomic events will impact (virtually) all stocks on the market.
Some stocks are more sensitive to general market forces than others. Beta can be a useful tool to understand how much a stock is influenced by market risk (volatility). However, Warren Buffett said ‘volatility is far from synonymous with risk’ in his 2014 letter to investors. So, while useful, beta is not the only metric to consider. To use beta as an investor, you must first understand that the overall market has a beta of one. Any stock with a beta of greater than one is considered more volatile than the market, while those with a beta below one are either less volatile or poorly correlated with the market.
See our latest analysis for Boadicea Resources
Want to help shape the future of investing tools? Participate in a short research study and receive a subscription valued at $60.
What we can learn from BOA’s beta value
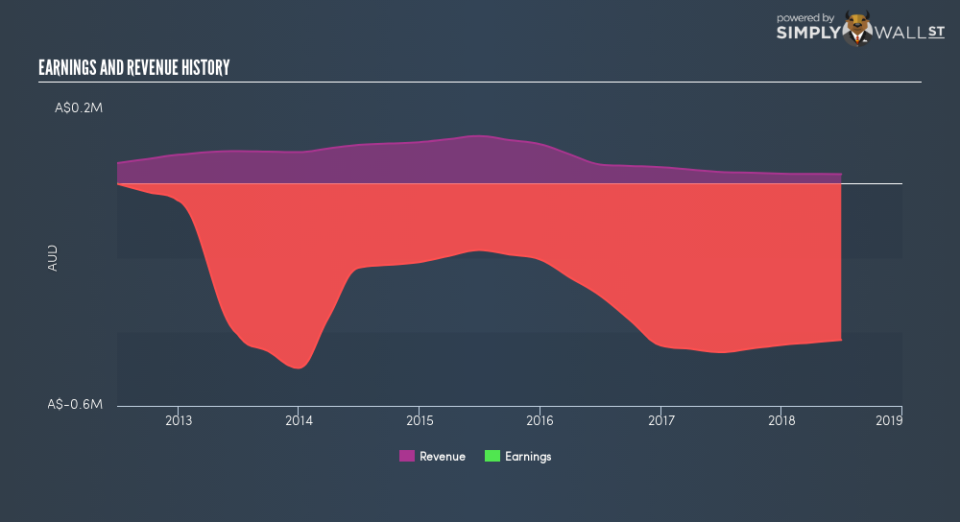
Zooming in on Boadicea Resources, we see it has a five year beta of 1.81. This is above 1, so historically its share price has been influenced by the broader volatility of the stock market the market. If the past is any guide, we would expect that Boadicea Resources shares will rise quicker than the markets in times of optimism, but fall faster in times of pessimism. Many would argue that beta is useful in position sizing, but fundamental metrics such as revenue and earnings are more important overall. You can see Boadicea Resources’s revenue and earnings in the image below.
How does BOA’s size impact its beta?
With a market capitalisation of AU$8.2m, Boadicea Resources is a very small company by global standards. It is quite likely to be unknown to most investors. Relatively few investors can influence the price of a smaller company, compared to a large company. This could explain the high beta value, in this case.
What this means for you:
Since Boadicea Resources has a reasonably high beta, it’s worth considering why it is so heavily influenced by broader market sentiment. For example, it might be a high growth stock or have a lot of operating leverage in its business model. In order to fully understand whether BOA is a good investment for you, we also need to consider important company-specific fundamentals such as Boadicea Resources’s financial health and performance track record. I urge you to continue your research by taking a look at the following:
Financial Health: Are BOA’s operations financially sustainable? Balance sheets can be hard to analyze, which is why we’ve done it for you. Check out our financial health checks here.
Past Track Record: Has BOA been consistently performing well irrespective of the ups and downs in the market? Go into more detail in the past performance analysis and take a look at the free visual representations of BOA’s historicals for more clarity.
Other High-Performing Stocks: Are there other stocks that provide better prospects with proven track records? Explore our free list of these great stocks here.
To help readers see past the short term volatility of the financial market, we aim to bring you a long-term focused research analysis purely driven by fundamental data. Note that our analysis does not factor in the latest price-sensitive company announcements.
The author is an independent contributor and at the time of publication had no position in the stocks mentioned. For errors that warrant correction please contact the editor at editorial-team@simplywallst.com.
