
 Yahoo Finance
 Blackmores Limited (ASX:BKL) Delivered A Better ROE Than The Industry, Here’s Why

The content of this article will benefit those of you who are starting to educate yourself about investing in the stock market and want to better understand how you can grow your money by investing in Blackmores Limited (ASX:BKL).
Blackmores Limited (ASX:BKL) delivered an ROE of 36.36% over the past 12 months, which is an impressive feat relative to its industry average of 17.73% during the same period. While the impressive ratio tells us that BKL has made significant profits from little equity capital, ROE doesn’t tell us if BKL has borrowed debt to make this happen. Today, we’ll take a closer look at some factors like financial leverage to see how sustainable BKL’s ROE is. View out our latest analysis for Blackmores
Peeling the layers of ROE – trisecting a company’s profitability
Return on Equity (ROE) weighs Blackmores’s profit against the level of its shareholders’ equity. For example, if the company invests A$1 in the form of equity, it will generate A$0.36 in earnings from this. While a higher ROE is preferred in most cases, there are several other factors we should consider before drawing any conclusions.
Return on Equity = Net Profit ÷ Shareholders Equity
ROE is assessed against cost of equity, which is measured using the Capital Asset Pricing Model (CAPM) – but let’s not dive into the details of that today. For now, let’s just look at the cost of equity number for Blackmores, which is 8.55%. Given a positive discrepancy of 27.80% between return and cost, this indicates that Blackmores pays less for its capital than what it generates in return, which is a sign of capital efficiency. ROE can be broken down into three different ratios: net profit margin, asset turnover, and financial leverage. This is called the Dupont Formula:
Dupont Formula
ROE = profit margin × asset turnover × financial leverage
ROE = (annual net profit ÷ sales) × (sales ÷ assets) × (assets ÷ shareholders’ equity)
ROE = annual net profit ÷ shareholders’ equity

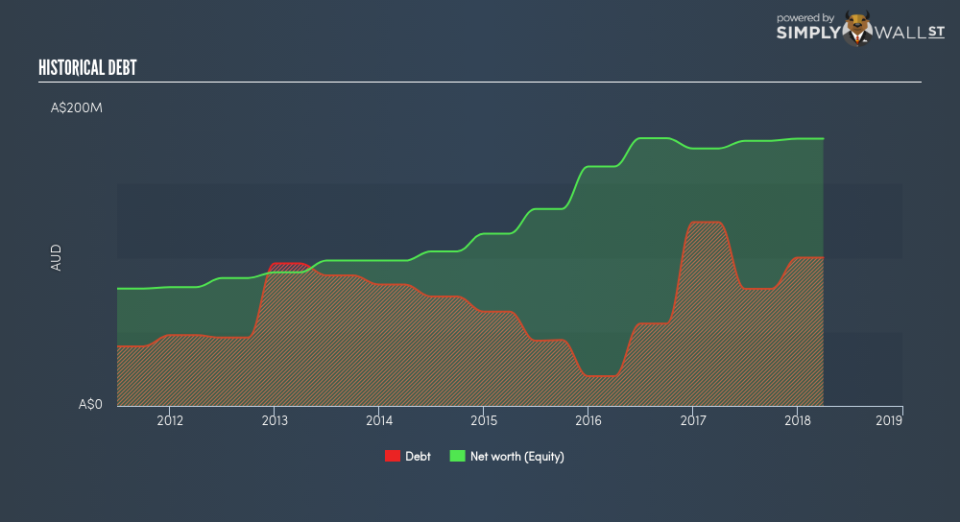
Essentially, profit margin shows how much money the company makes after paying for all its expenses. The other component, asset turnover, illustrates how much revenue Blackmores can make from its asset base. The most interesting ratio, and reflective of sustainability of its ROE, is financial leverage. Since ROE can be inflated by excessive debt, we need to examine Blackmores’s debt-to-equity level. At 55.47%, Blackmores’s debt-to-equity ratio appears sensible and indicates the above-average ROE is generated from its capacity to increase profit without a large debt burden.
Next Steps:
ROE is a simple yet informative ratio, illustrating the various components that each measure the quality of the overall stock. Blackmores’s above-industry ROE is encouraging, and is also in excess of its cost of equity. ROE is not likely to be inflated by excessive debt funding, giving shareholders more conviction in the sustainability of high returns. Although ROE can be a useful metric, it is only a small part of diligent research.
For Blackmores, there are three relevant factors you should further examine:
Financial Health: Does it have a healthy balance sheet? Take a look at our free balance sheet analysis with six simple checks on key factors like leverage and risk.
Valuation: What is Blackmores worth today? Is the stock undervalued, even when its growth outlook is factored into its intrinsic value? The intrinsic value infographic in our free research report helps visualize whether Blackmores is currently mispriced by the market.
Other High-Growth Alternatives : Are there other high-growth stocks you could be holding instead of Blackmores? Explore our interactive list of stocks with large growth potential to get an idea of what else is out there you may be missing!
To help readers see pass the short term volatility of the financial market, we aim to bring you a long-term focused research analysis purely driven by fundamental data. Note that our analysis does not factor in the latest price sensitive company announcements.
The author is an independent contributor and at the time of publication had no position in the stocks mentioned.
