
 Yahoo Finance
 Blackmores' (ASX:BKL) Shareholders Are Down 63% On Their Shares
While not a mind-blowing move, it is good to see that the Blackmores Limited (ASX:BKL) share price has gained 16% in the last three months. But that can't change the reality that over the longer term (five years), the returns have been really quite dismal. Indeed, the share price is down 63% in the period. So we're hesitant to put much weight behind the short term increase. But it could be that the fall was overdone.
View our latest analysis for Blackmores
There is no denying that markets are sometimes efficient, but prices do not always reflect underlying business performance. One imperfect but simple way to consider how the market perception of a company has shifted is to compare the change in the earnings per share (EPS) with the share price movement.
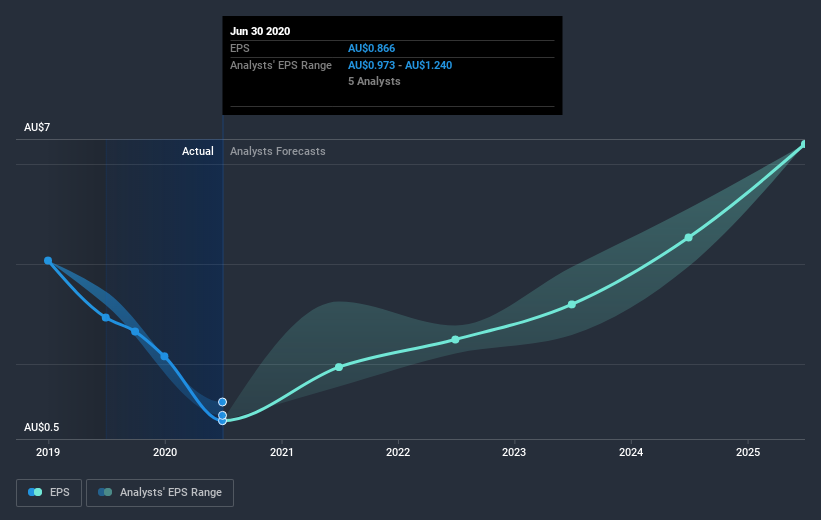
Looking back five years, both Blackmores' share price and EPS declined; the latter at a rate of 20% per year. Notably, the share price has fallen at 18% per year, fairly close to the change in the EPS. This suggests that market participants have not changed their view of the company all that much. Rather, the share price change has reflected changes in earnings per share.
You can see how EPS has changed over time in the image below (click on the chart to see the exact values).
We consider it positive that insiders have made significant purchases in the last year. Even so, future earnings will be far more important to whether current shareholders make money. It might be well worthwhile taking a look at our free report on Blackmores' earnings, revenue and cash flow.
What about the Total Shareholder Return (TSR)?
Investors should note that there's a difference between Blackmores' total shareholder return (TSR) and its share price change, which we've covered above. The TSR attempts to capture the value of dividends (as if they were reinvested) as well as any spin-offs or discounted capital raisings offered to shareholders. Blackmores' TSR of was a loss of 59% for the 5 years. That wasn't as bad as its share price return, because it has paid dividends.
A Different Perspective
While the broader market gained around 4.0% in the last year, Blackmores shareholders lost 15%. Even the share prices of good stocks drop sometimes, but we want to see improvements in the fundamental metrics of a business, before getting too interested. However, the loss over the last year isn't as bad as the 10% per annum loss investors have suffered over the last half decade. We would want clear information suggesting the company will grow, before taking the view that the share price will stabilize. It's always interesting to track share price performance over the longer term. But to understand Blackmores better, we need to consider many other factors. For example, we've discovered 2 warning signs for Blackmores that you should be aware of before investing here.
Blackmores is not the only stock insiders are buying. So take a peek at this free list of growing companies with insider buying.
Please note, the market returns quoted in this article reflect the market weighted average returns of stocks that currently trade on AU exchanges.
This article by Simply Wall St is general in nature. It does not constitute a recommendation to buy or sell any stock, and does not take account of your objectives, or your financial situation. We aim to bring you long-term focused analysis driven by fundamental data. Note that our analysis may not factor in the latest price-sensitive company announcements or qualitative material. Simply Wall St has no position in any stocks mentioned.
Have feedback on this article? Concerned about the content? Get in touch with us directly. Alternatively, email editorial-team (at) simplywallst.com.
