
 Yahoo Finance
 Big Lots' (BIG) Q3 Loss In Line, Comparable Sales Decline Y/Y
Big Lots, Inc. BIG reported loss per share for third-quarter fiscal 2021 while sales surpassed the Zacks Consensus Estimate. Both the top and the bottom line compared unfavorably with the year-earlier metrics.
This Columbus, OH-based player reported a loss of 14 cents per share, which came in line with the Zacks Consensus Estimate. The year-earlier quarter witnessed earnings of 76 cents a share. Management had guided loss per share of 10-20 cents for the fiscal third quarter.
Net sales dipped 3.1% to $1,335.7 million year over year but came above the Zacks Consensus Estimate of $1,322 million. The year-over-year decline was due to soft comparable sales. Comparable sales fell 4.7% against a 17.8% rise seen last year. Net new stores and relocations contributed roughly 160 basis points to sales. The metric grew 16.4% from the second-quarter fiscal 2019 level.
So far this year, shares of this currently Zacks Rank #3 (Hold) Big Lots have increased 8.7% compared with the industry’s 16.9% growth.
More Q3 Facts
On a two-year basis, comparable sales rose 12.3% despite supply-chain headwinds and the expiration of stimulus benefits. Sales gained from growth in basket, backed by AUR expansion at each category and positive mix impacts. On a two-year basis, Big Lots posted positive comps in Furniture, Seasonal, Soft Home, Hard Home, Apparel, Electronics and other.
BIG’s Broyhill and Real Living brands are performing well with each having the potential to bring in $1 billion sales, annually.
Big Lots, Inc. Price, Consensus and EPS Surprise
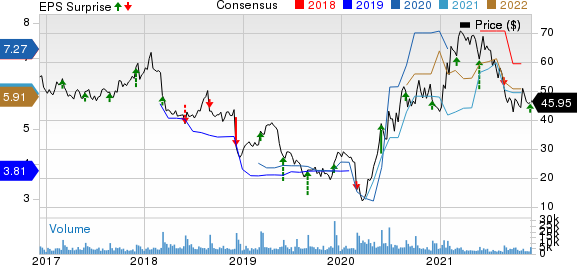
Big Lots, Inc. price-consensus-eps-surprise-chart | Big Lots, Inc. Quote
On a year-to-date basis, Big Lots’ e-commerce sales have grown around 300% from the 2019 level. Management believes that e-commerce will become a $1-billion business in the next few years. BIG raised the number of stores providing ship from store fulfillment to 65 to boost sales during the holiday period.
Big Lots continues to experience strength in the Operation North Star strategy and is focused on its key drivers, including customer growth, merchandise productivity, e-commerce and store count. In the reported quarter, Rewards active members were up above 9% year over year. Rewards members constituted 64% of transactions and 76% of sales, both up 400 basis points (bps) from last-year levels. Also, The LOT! and Queue Line strategies are now being rolled out to 1,300 stores, and are contributing to its sales.
Gross profit tumbled 6.9% year over year to $519.2 million with gross margin contracting 160 bps to 38.9%. Gross margin was driven by significant freight headwinds.
In the reported quarter, selling and administrative expenses came in at $487.4 million, up 1.1% year over year. Also, the metric (as a percentage of net sales) expanded 150 bps from the prior-year quarter’s tally of 36.5%. BIG recorded an operating loss of $4.1 million versus the operating profit of $42.5 million recorded in the prior-year quarter.
Other Financial Details
The currently Zacks Rank #3 (Hold) Big Lots ended the quarter with cash and cash equivalents of $70.6 million with no long-term debt. Total shareholders’ equity was $1,049.8 million. Inventories increased 17.3% to $1,277.2 million in the fiscal third quarter.
In the nine months of fiscal 2021, BIG generated net cash worth $75.7 million from operating activities. Capital expenditures totaled $46 million in the reported quarter. For fiscal 2021, capital expenditures are anticipated between $170 million and $180 million.
During the reported quarter, Big Lots completed the $500-million share repurchase authorized on Aug 27, 2020. Management bought back 2 million shares for $97 million. Overall, BIG repurchased 9.3 million shares under the 2020 authorization. The board also announced a quarterly cash dividend of 30 cents a share, payable Dec 29, 2021 to its shareholders of record as of Dec 15.
Big Lots opened 12 outlets and shuttered seven in the reported quarter, increasing the total store count to 1,418. For fiscal 2021, management projects to open about 55 stores, of which 20 will be relocations. The capital projection suggests roughly 50 Project Refresh stores for fiscal 2021.
Outlook
For fourth-quarter fiscal 2021, management expects a slight positive comparable sales increase, equating to two-year comparable sales growth in high-single digits. Management predicts a sales gain of about 180 bps for the fiscal fourth quarter as a result of net new store openings.
Big Lots anticipates the gross margin to decline nearly 150 bps year over year due to freight headwinds. Earnings per share are likely to come in the band of $2.05-$2.20 for the same period, down from $2.59 earned in the year-earlier quarter.
For the fiscal fourth quarter, management expects expenses to increase by a mid-single-digit percentage year over year due to incremental investments in stores and distribution centers.
For fiscal 2021, BIG forecasts a negative low single-digit decline in comparable sales, equating to a double-digit positive comparable sales rise on a two-year basis. Higher freight costs are likely to cause a 120-bps decline in gross margin in the current fiscal. Big Lots envisions full-fiscal earnings per share of $5.70-$5.85. The outlook does not incorporate further potential share repurchases in the current fiscal year.
For the current fiscal year, SG&A expenses are likely to rise nearly 3%, induced by the impact of the sale and leaseback of the distribution centers, higher supply-chain expenses, including investments in strategic investments and increased equity compensation expenses.
3 Hot Stocks in Retail
Some better-ranked stocks are Boot Barn Holdings BOOT, Tractor Supply Co. TSCO and Target TGT.
Boot Barn Holdings, a lifestyle retailer of western and work-related footwear, apparel and accessories, sports a Zacks Rank #1 (Strong Buy) at present. The stock has jumped 65.9% in the past six months. You can see the complete list of today’s Zacks #1 Rank stocks here.
The Zacks Consensus Estimate for Boot Barn Holdings’ current financial-year sales and earnings per share (EPS) suggests growth of 54.4% and 183.3%, respectively, from the year-ago period’s corresponding figures. BOOT has a trailing four-quarter earnings surprise of 35.3%, on average.
Tractor Supply Company, a rural lifestyle retailer in the United States, currently flaunts a Zacks Rank of 1. TSCO has a trailing four-quarter earnings surprise of 22.8%, on average. Shares of TSCO have surged 35.8% in the past six months.
The Zacks Consensus Estimate for Tractor Supply Company’s current-year sales and EPS suggests growth of 19% and 23.9%, respectively, from the year-ago period’s corresponding readings. TSCO has an expected EPS growth rate of 9.6% for three-five years.
Target, a renowned omnichannel retailer, presently carries a Zacks Rank #2 (Buy). TGT has a trailing four-quarter earnings surprise of 19.7%, on average. The stock has rallied 29.8% in the past six months.
The Zacks Consensus Estimate for Target’s current-year sales and EPS suggests growth of 14% and 39.6%, respectively, from the corresponding year-ago period’s levels. TGT has an expected EPS growth rate of 14.4% for three-five years.
Want the latest recommendations from Zacks Investment Research? Today, you can download 7 Best Stocks for the Next 30 Days. Click to get this free report
Target Corporation (TGT) : Free Stock Analysis Report
Tractor Supply Company (TSCO) : Free Stock Analysis Report
Big Lots, Inc. (BIG) : Free Stock Analysis Report
Boot Barn Holdings, Inc. (BOOT) : Free Stock Analysis Report
To read this article on Zacks.com click here.
Zacks Investment Research
