
 Yahoo Finance
 Best Buy's (BBY) Q3 Earnings Beat, Comparable Sales Fall 10.4%
Best Buy Co., Inc. BBY posted better-than-expected results for third-quarter fiscal 2023 results, wherein the top and the bottom line outpaced the Zacks Consensus Estimate. However, both sales and earnings decreased year over year.
Over the past six months, this presently Zacks Rank #3 (Hold) stock has lost 14.6% compared to the industry’s plunge of 27.4%.
Q3 Details
Best Buy’s adjusted earnings of $1.38 per share beat the Zacks Consensus Estimate of $1.03 and our estimate of $1.01. The bottom line decreased from $2.08 recorded in the year-ago fiscal period.
Enterprise revenues declined 12.8% from the last fiscal year’s quarterly number to $10,587 million, exceeding the Zacks Consensus Estimate of $10,324 million and our estimate of $10,325 million. Enterprise comparable sales dropped 10.4% against 1.6% growth seen in the year-ago fiscal quarter.
Best Buy Co., Inc. Price, Consensus and EPS Surprise
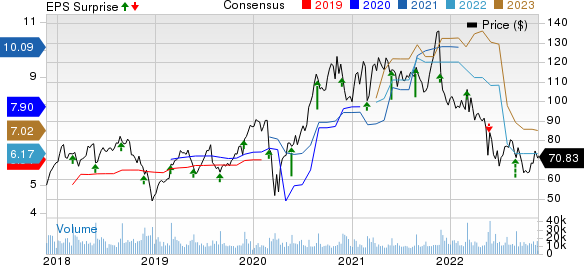
Best Buy Co., Inc. price-consensus-eps-surprise-chart | Best Buy Co., Inc. Quote
Gross profit declined 16.8% to $2,332 million, while gross margin contracted 150 basis points (bps) to 22%. Adjusted operating income came in at $378 million, down from $634 million recorded in the year-ago fiscal quarter. Adjusted operating margin shrank 190 bps to 3.9%.
We note that adjusted SG&A expenses fell 9% to $1,941 million, while as a percentage of revenues, the same increased 40 bps to 18.3%.
Segment Details
Domestic segment revenues fell 10.8% to $9,800 million. This decline from the last fiscal year’s quarterly reading was mainly induced by a comparable sales decrease of 10.5%. From a merchandising perspective, comparable sales decreased in almost all categories, with the major drivers being computing and home theater.
Domestic online revenues of $3.04 billion declined 11.6% from the last fiscal year’s quarterly tally on a comparable basis. As a percentage of total domestic revenues, online revenues were 31% compared with the last fiscal year’s 31.3%.
Segment adjusted gross profit rate decreased 150 basis points to 21.9% due to lower services margin rates with pressures related to Best Buy’s Totaltech membership offering, reduced product margin rates and increased supply-chain costs. This was partly offset by increased profit-sharing revenues from its private label and co-branded credit card arrangement.
In the International segment, revenues fell 14.9% to $787 million, mainly due to a comparable sales decline of 9.3% and adverse foreign currency translations of 480 bps. The segment’s gross profit rate decreased 160 bps to 23.4%, induced by lower product margin rates and increased supply-chain costs.
Other Details
Best Buy ended the quarter with cash and cash equivalents of $932 million, long-term debt of $1,142 million and total equity of $2,993 million.
At the end of the reported quarter, merchandise inventories of $7,294 million decreased 14.7% from the year-ago fiscal quarter’s reading due to lower revenues and the impact of the timing of inventory receipts.
During the quarter, BBY returned about $198 million to its shareholders via dividends. Year to date, Best Buy has returned a total of $1.06 billion to its shareholders through share repurchases of $465 million and dividends worth $595 million. Management informed that it resumed share repurchases in November after pausing in the preceding fiscal quarter. It now expects to make share repurchases of roughly $1 billion in fiscal 2023.
BBY’s board authorized a quarterly cash dividend of 88 cents per share, payable Jan 3, 2023, to its shareholders of record as of Dec 13, 2022.
Guidance
For fiscal 2023, management envisions a comparable sales decline of about 10% and the adjusted operating income rate to be slightly above 4%.
3 Top Retail Stocks
We highlighted three better-ranked stocks, namely Tecnoglass TGLS, GMS GMS and Wingstop WING.
Tecnoglass manufactures and sells architectural glass and windows, and aluminum products for the residential and commercial construction industries. TGLS currently sports a Zacks Rank #1 (Strong Buy). You can see the complete list of today’s Zacks #1 Rank stocks here.
The Zacks Consensus Estimate for Tecnoglass’ current financial-year sales and earnings per share suggests growth of 40.5% and 76.4%, respectively, from the corresponding year-ago reported figures. TGLS has a trailing four-quarter earnings surprise of 26.9%, on average.
GMS, a distributor of wallboard and suspended ceiling systems, currently flaunts a Zacks Rank of 1. GMS has a trailing four-quarter earnings surprise of 10.8%, on average.
The Zacks Consensus Estimate for GMS’ current financial-year sales and EPS suggests growth of 10.8% and 10.2% each from the respective year-ago reported figures. GMS has an expected EPS growth rate of 10.7% for three-five years.
Wingstop, which franchises and operates restaurants, is currently Zacks #1 Ranked. The company has a trailing four-quarter earnings surprise of 5.8%, on average.
The Zacks Consensus Estimate for Wingstop’s current financial-year sales and earnings per share suggests growth of 25.3% and 22.2%, respectively, from the comparable year-ago reported numbers. WING has an expected EPS growth rate of 11% for three-five years.
Want the latest recommendations from Zacks Investment Research? Today, you can download 7 Best Stocks for the Next 30 Days. Click to get this free report
Best Buy Co., Inc. (BBY) : Free Stock Analysis Report
Tecnoglass Inc. (TGLS) : Free Stock Analysis Report
Wingstop Inc. (WING) : Free Stock Analysis Report
GMS Inc. (GMS) : Free Stock Analysis Report
