
 Yahoo Finance
 What is Behind BWP Trust’s (ASX:BWP) Superior ROE?

This analysis is intended to introduce important early concepts to people who are starting to invest and want to begin learning the link between BWP Trust (ASX:BWP)’s return fundamentals and stock market performance.
BWP Trust (ASX:BWP) delivered an ROE of 14.02% over the past 12 months, which is an impressive feat relative to its industry average of 13.18% during the same period. Superficially, this looks great since we know that BWP has generated big profits with little equity capital; however, ROE doesn’t tell us how much BWP has borrowed in debt. We’ll take a closer look today at factors like financial leverage to determine whether BWP’s ROE is actually sustainable. Check out our latest analysis for BWP Trust
Breaking down ROE — the mother of all ratios
Firstly, Return on Equity, or ROE, is simply the percentage of last years’ earning against the book value of shareholders’ equity. It essentially shows how much the company can generate in earnings given the amount of equity it has raised. While a higher ROE is preferred in most cases, there are several other factors we should consider before drawing any conclusions.
Return on Equity = Net Profit ÷ Shareholders Equity
ROE is assessed against cost of equity, which is measured using the Capital Asset Pricing Model (CAPM) – but let’s not dive into the details of that today. For now, let’s just look at the cost of equity number for BWP Trust, which is 8.55%. Given a positive discrepancy of 5.46% between return and cost, this indicates that BWP Trust pays less for its capital than what it generates in return, which is a sign of capital efficiency. ROE can be split up into three useful ratios: net profit margin, asset turnover, and financial leverage. This is called the Dupont Formula:
Dupont Formula
ROE = profit margin × asset turnover × financial leverage
ROE = (annual net profit ÷ sales) × (sales ÷ assets) × (assets ÷ shareholders’ equity)
ROE = annual net profit ÷ shareholders’ equity

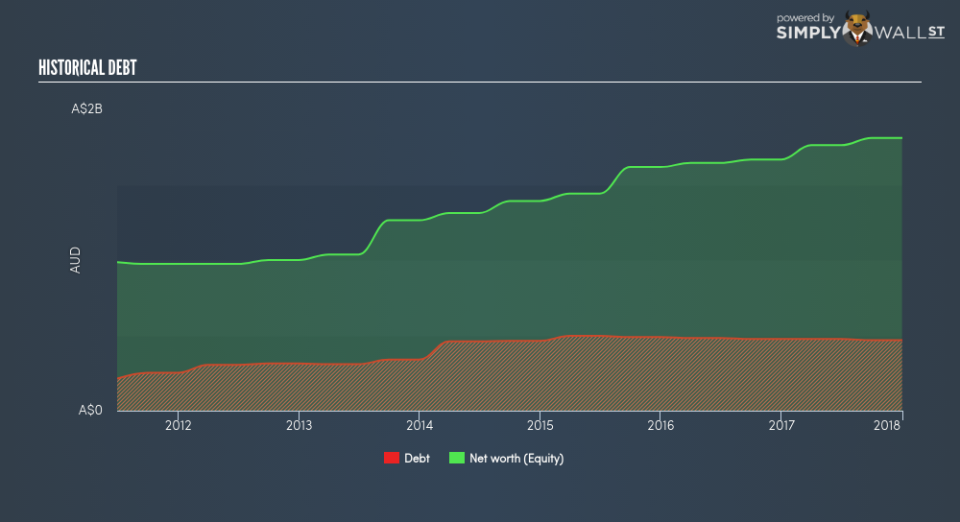
Essentially, profit margin shows how much money the company makes after paying for all its expenses. Asset turnover reveals how much revenue can be generated from BWP Trust’s asset base. Finally, financial leverage will be our main focus today. It shows how much of assets are funded by equity and can show how sustainable the company’s capital structure is. Since ROE can be artificially increased through excessive borrowing, we should check BWP Trust’s historic debt-to-equity ratio. At 25.88%, BWP Trust’s debt-to-equity ratio appears low and indicates the above-average ROE is generated from its capacity to increase profit without a large debt burden.
Next Steps:
While ROE is a relatively simple calculation, it can be broken down into different ratios, each telling a different story about the strengths and weaknesses of a company. BWP Trust’s above-industry ROE is encouraging, and is also in excess of its cost of equity. Its high ROE is not likely to be driven by high debt. Therefore, investors may have more confidence in the sustainability of this level of returns going forward. ROE is a helpful signal, but it is definitely not sufficient on its own to make an investment decision.
For BWP Trust, there are three fundamental factors you should further research:
Financial Health: Does it have a healthy balance sheet? Take a look at our free balance sheet analysis with six simple checks on key factors like leverage and risk.
Valuation: What is BWP Trust worth today? Is the stock undervalued, even when its growth outlook is factored into its intrinsic value? The intrinsic value infographic in our free research report helps visualize whether BWP Trust is currently mispriced by the market.
Other High-Growth Alternatives : Are there other high-growth stocks you could be holding instead of BWP Trust? Explore our interactive list of stocks with large growth potential to get an idea of what else is out there you may be missing!
To help readers see pass the short term volatility of the financial market, we aim to bring you a long-term focused research analysis purely driven by fundamental data. Note that our analysis does not factor in the latest price sensitive company announcements.
The author is an independent contributor and at the time of publication had no position in the stocks mentioned.
