
 Yahoo Finance
 Barnes & Noble Education (NYSE:BNED investor five-year losses grow to 73% as the stock sheds US$14m this past week
Barnes & Noble Education, Inc. (NYSE:BNED) shareholders should be happy to see the share price up 16% in the last month. But will that repair the damage for the weary investors who have owned this stock as it declined over half a decade? Probably not. In fact, the share price has tumbled down a mountain to land 73% lower after that period. The recent bounce might mean the long decline is over, but we are not confident. The real question is whether the business can leave its past behind and improve itself over the years ahead.
Since Barnes & Noble Education has shed US$14m from its value in the past 7 days, let's see if the longer term decline has been driven by the business' economics.
See our latest analysis for Barnes & Noble Education
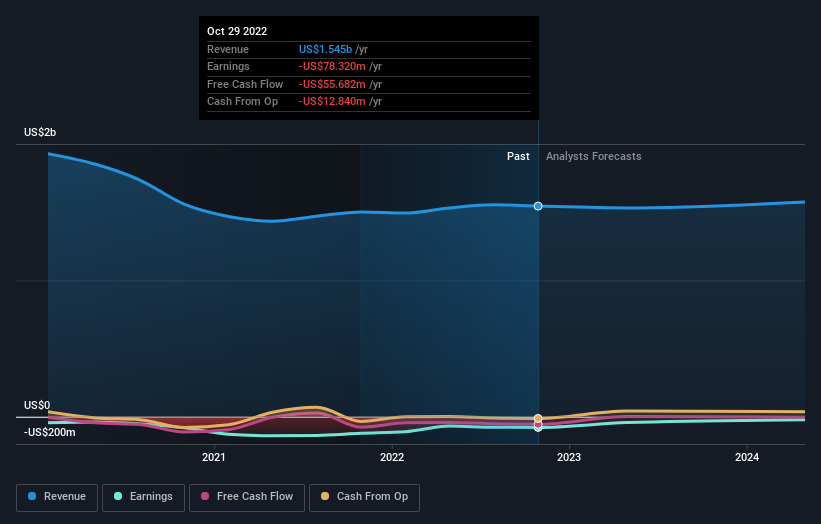
Barnes & Noble Education isn't currently profitable, so most analysts would look to revenue growth to get an idea of how fast the underlying business is growing. When a company doesn't make profits, we'd generally expect to see good revenue growth. As you can imagine, fast revenue growth, when maintained, often leads to fast profit growth.
Over half a decade Barnes & Noble Education reduced its trailing twelve month revenue by 9.5% for each year. That puts it in an unattractive cohort, to put it mildly. So it's not that strange that the share price dropped 12% per year in that period. This kind of price performance makes us very wary, especially when combined with falling revenue. Of course, the poor performance could mean the market has been too severe selling down. That can happen.
The image below shows how earnings and revenue have tracked over time (if you click on the image you can see greater detail).
We consider it positive that insiders have made significant purchases in the last year. Even so, future earnings will be far more important to whether current shareholders make money. You can see what analysts are predicting for Barnes & Noble Education in this interactive graph of future profit estimates.
A Different Perspective
While the broader market lost about 10% in the twelve months, Barnes & Noble Education shareholders did even worse, losing 67%. Having said that, it's inevitable that some stocks will be oversold in a falling market. The key is to keep your eyes on the fundamental developments. Unfortunately, last year's performance may indicate unresolved challenges, given that it was worse than the annualised loss of 12% over the last half decade. Generally speaking long term share price weakness can be a bad sign, though contrarian investors might want to research the stock in hope of a turnaround. It's always interesting to track share price performance over the longer term. But to understand Barnes & Noble Education better, we need to consider many other factors. For instance, we've identified 4 warning signs for Barnes & Noble Education that you should be aware of.
If you like to buy stocks alongside management, then you might just love this free list of companies. (Hint: insiders have been buying them).
Please note, the market returns quoted in this article reflect the market weighted average returns of stocks that currently trade on US exchanges.
Have feedback on this article? Concerned about the content? Get in touch with us directly. Alternatively, email editorial-team (at) simplywallst.com.
This article by Simply Wall St is general in nature. We provide commentary based on historical data and analyst forecasts only using an unbiased methodology and our articles are not intended to be financial advice. It does not constitute a recommendation to buy or sell any stock, and does not take account of your objectives, or your financial situation. We aim to bring you long-term focused analysis driven by fundamental data. Note that our analysis may not factor in the latest price-sensitive company announcements or qualitative material. Simply Wall St has no position in any stocks mentioned.
Join A Paid User Research Session
You’ll receive a US$30 Amazon Gift card for 1 hour of your time while helping us build better investing tools for the individual investors like yourself. Sign up here
