
 Yahoo Finance
 Bank of Queensland's (ASX:BOQ) Shareholders Are Down 53% On Their Shares

While not a mind-blowing move, it is good to see that the Bank of Queensland Limited (ASX:BOQ) share price has gained 29% in the last three months. But that doesn't change the fact that the returns over the last five years have been less than pleasing. After all, the share price is down 53% in that time, significantly under-performing the market.
See our latest analysis for Bank of Queensland
To quote Buffett, 'Ships will sail around the world but the Flat Earth Society will flourish. There will continue to be wide discrepancies between price and value in the marketplace...' By comparing earnings per share (EPS) and share price changes over time, we can get a feel for how investor attitudes to a company have morphed over time.
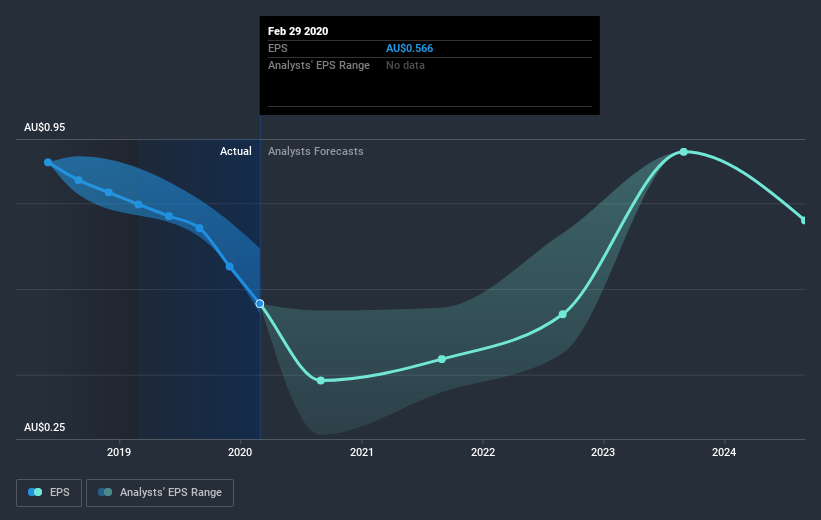
Looking back five years, both Bank of Queensland's share price and EPS declined; the latter at a rate of 6.4% per year. Readers should note that the share price has fallen faster than the EPS, at a rate of 14% per year, over the period. This implies that the market was previously too optimistic about the stock. The less favorable sentiment is reflected in its current P/E ratio of 10.71.
The image below shows how EPS has tracked over time (if you click on the image you can see greater detail).
We consider it positive that insiders have made significant purchases in the last year. Having said that, most people consider earnings and revenue growth trends to be a more meaningful guide to the business. It might be well worthwhile taking a look at our free report on Bank of Queensland's earnings, revenue and cash flow.
What About Dividends?
As well as measuring the share price return, investors should also consider the total shareholder return (TSR). The TSR is a return calculation that accounts for the value of cash dividends (assuming that any dividend received was reinvested) and the calculated value of any discounted capital raisings and spin-offs. So for companies that pay a generous dividend, the TSR is often a lot higher than the share price return. In the case of Bank of Queensland, it has a TSR of -36% for the last 5 years. That exceeds its share price return that we previously mentioned. And there's no prize for guessing that the dividend payments largely explain the divergence!
A Different Perspective
We regret to report that Bank of Queensland shareholders are down 31% for the year (even including dividends). Unfortunately, that's worse than the broader market decline of 4.6%. However, it could simply be that the share price has been impacted by broader market jitters. It might be worth keeping an eye on the fundamentals, in case there's a good opportunity. Regrettably, last year's performance caps off a bad run, with the shareholders facing a total loss of 6.3% per year over five years. Generally speaking long term share price weakness can be a bad sign, though contrarian investors might want to research the stock in hope of a turnaround. It's always interesting to track share price performance over the longer term. But to understand Bank of Queensland better, we need to consider many other factors. Even so, be aware that Bank of Queensland is showing 2 warning signs in our investment analysis , you should know about...
If you like to buy stocks alongside management, then you might just love this free list of companies. (Hint: insiders have been buying them).
Please note, the market returns quoted in this article reflect the market weighted average returns of stocks that currently trade on AU exchanges.
This article by Simply Wall St is general in nature. It does not constitute a recommendation to buy or sell any stock, and does not take account of your objectives, or your financial situation. We aim to bring you long-term focused analysis driven by fundamental data. Note that our analysis may not factor in the latest price-sensitive company announcements or qualitative material. Simply Wall St has no position in any stocks mentioned.
Have feedback on this article? Concerned about the content? Get in touch with us directly. Alternatively, email editorial-team@simplywallst.com.