
 Yahoo Finance
 Is Bank of Queensland Limited (ASX:BOQ) Over-Exposed To Risk?

Post-GFC recovery has led to improving credit quality and a strong growth environment for the banking sector. Economic growth impacts the stability of salaries and interest rate level which in turn affects borrowers’ demand for, and ability to repay, their loans. As a small-cap bank with a market capitalisation of AU$4.40b, Bank of Queensland Limited’s (ASX:BOQ) profit and value are directly affected by economic activity. Risk associate with repayment is measured by the level of bad debt which is an expense written off Bank of Queensland’s bottom line. Since the level of risky assets held by the bank impacts the attractiveness of it as an investment, I will take you through three metrics that are insightful proxies for risk.
Check out our latest analysis for Bank of Queensland
How Good Is Bank of Queensland At Forecasting Its Risks?
Bank of Queensland’s ability to forecast and provision for its bad loans indicates it has a good understanding of the level of risk it is taking on. If the level of provisioning covers 100% or more of the actual bad debt expense the bank writes off, then it is relatively accurate and prudent in its bad debt provisioning. Given its high bad loan to bad debt ratio of 126.59% Bank of Queensland has cautiously over-provisioned 26.59% above the appropriate minimum, indicating a safe and prudent forecasting methodology, and its ability to anticipate the factors contributing to its bad loan levels.
What Is An Appropriate Level Of Risk?
Bank of Queensland is engaging in risking lending practices if it is over-exposed to bad debt. Total loans should generally be made up of less than 3% of loans that are considered unrecoverable, also known as bad debt. When these loans are not repaid, they are written off as expenses which comes out directly from Bank of Queensland’s profit. The bank’s bad debt only makes up a very small 0.39% to total debt which means means the bank has very strict bad debt management and faces insignificant levels of default.
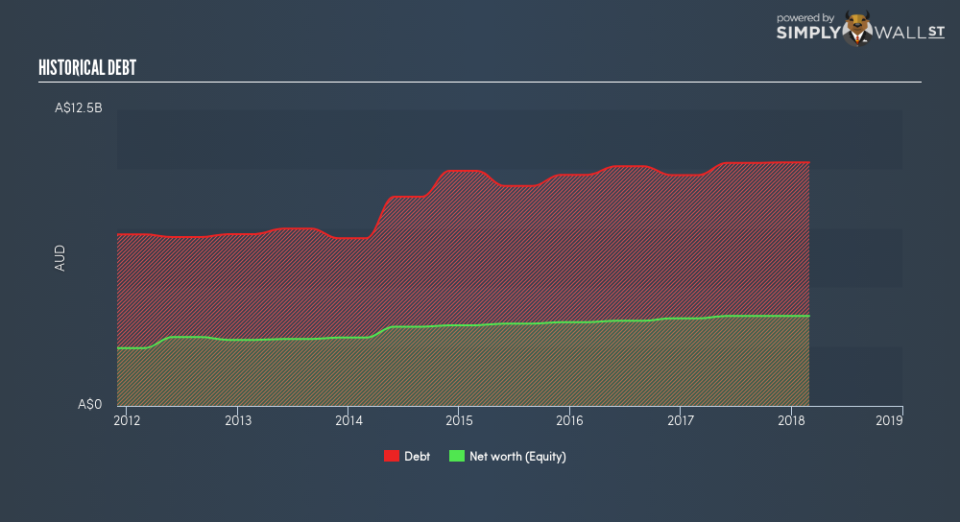
How Big Is Bank of Queensland’s Safety Net?

Bank of Queensland profits from lending out its various forms of borrowings and charging interest rates. Deposits from customers tend to carry the lowest risk due to the relatively stable interest rate and amount available. As a rule, a bank is considered less risky if it holds a higher level of deposits. Since Bank of Queensland’s total deposit to total liabilities is within the sensible margin at 77.5% compared to other banks’ level of 50%, it shows a prudent level of the bank’s safer form of borrowing and an appropriate level of risk.
Next Steps:
BOQ’s acquisition will impact the business moving forward. Keep an eye on how this decision plays out in the future, especially on its financial health and earnings growth. I’ve bookmarked BOQ’s company page on Simply Wall St to stay informed with changes in outlook and valuation. This is also the source of data for this article. The three main sections I’d recommend you check out are:
Future Outlook: What are well-informed industry analysts predicting for BOQ’s future growth? Take a look at our free research report of analyst consensus for BOQ’s outlook.
Valuation: What is BOQ worth today? Has the future growth potential already been factored into the price? The intrinsic value infographic in our free research report helps visualize whether BOQ is currently mispriced by the market.
Other High-Performing Stocks: Are there other stocks that provide better prospects with proven track records? Explore our free list of these great stocks here.
To help readers see past the short term volatility of the financial market, we aim to bring you a long-term focused research analysis purely driven by fundamental data. Note that our analysis does not factor in the latest price-sensitive company announcements.
The author is an independent contributor and at the time of publication had no position in the stocks mentioned. For errors that warrant correction please contact the editor at editorial-team@simplywallst.com.
