
 Yahoo Finance
 Bank of Queensland (ASX:BOQ) Share Prices Have Dropped 28% In The Last Three Years
It is doubtless a positive to see that the Bank of Queensland Limited (ASX:BOQ) share price has gained some 34% in the last three months. But that cannot eclipse the less-than-impressive returns over the last three years. After all, the share price is down 28% in the last three years, significantly under-performing the market.
See our latest analysis for Bank of Queensland
To paraphrase Benjamin Graham: Over the short term the market is a voting machine, but over the long term it's a weighing machine. One way to examine how market sentiment has changed over time is to look at the interaction between a company's share price and its earnings per share (EPS).
Bank of Queensland saw its EPS decline at a compound rate of 34% per year, over the last three years. This fall in the EPS is worse than the 10% compound annual share price fall. This suggests that the market retains some optimism around long term earnings stability, despite past EPS declines.
The company's earnings per share (over time) is depicted in the image below (click to see the exact numbers).
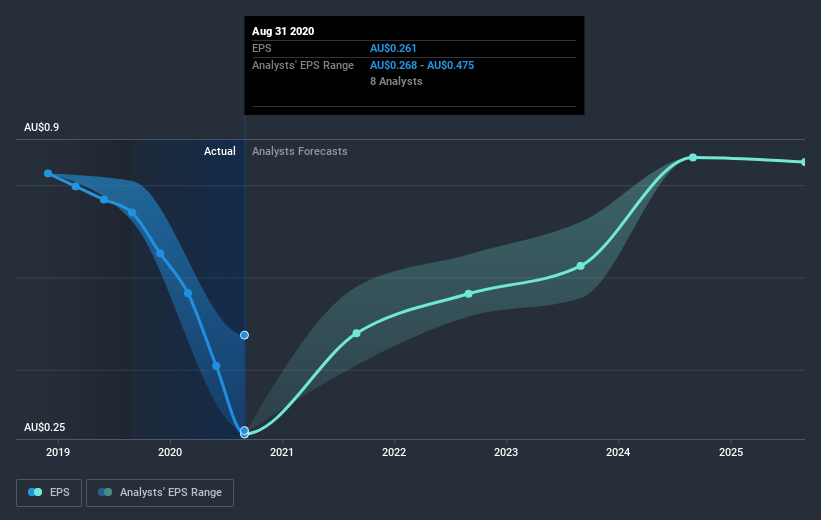
It might be well worthwhile taking a look at our free report on Bank of Queensland's earnings, revenue and cash flow.
What About Dividends?
When looking at investment returns, it is important to consider the difference between total shareholder return (TSR) and share price return. The TSR incorporates the value of any spin-offs or discounted capital raisings, along with any dividends, based on the assumption that the dividends are reinvested. Arguably, the TSR gives a more comprehensive picture of the return generated by a stock. As it happens, Bank of Queensland's TSR for the last 3 years was -15%, which exceeds the share price return mentioned earlier. This is largely a result of its dividend payments!
A Different Perspective
It's nice to see that Bank of Queensland shareholders have received a total shareholder return of 16% over the last year. And that does include the dividend. That's better than the annualised return of 1.9% over half a decade, implying that the company is doing better recently. Given the share price momentum remains strong, it might be worth taking a closer look at the stock, lest you miss an opportunity. It's always interesting to track share price performance over the longer term. But to understand Bank of Queensland better, we need to consider many other factors. Consider for instance, the ever-present spectre of investment risk. We've identified 2 warning signs with Bank of Queensland , and understanding them should be part of your investment process.
Of course, you might find a fantastic investment by looking elsewhere. So take a peek at this free list of companies we expect will grow earnings.
Please note, the market returns quoted in this article reflect the market weighted average returns of stocks that currently trade on AU exchanges.
This article by Simply Wall St is general in nature. It does not constitute a recommendation to buy or sell any stock, and does not take account of your objectives, or your financial situation. We aim to bring you long-term focused analysis driven by fundamental data. Note that our analysis may not factor in the latest price-sensitive company announcements or qualitative material. Simply Wall St has no position in any stocks mentioned.
Have feedback on this article? Concerned about the content? Get in touch with us directly. Alternatively, email editorial-team (at) simplywallst.com.
