
 Yahoo Finance
 Axcelis Technologies (NASDAQ:ACLS) sheds 3.3% this week, as yearly returns fall more in line with earnings growth
Long term investing can be life changing when you buy and hold the truly great businesses. And highest quality companies can see their share prices grow by huge amounts. To wit, the Axcelis Technologies, Inc. (NASDAQ:ACLS) share price has soared 663% over five years. And this is just one example of the epic gains achieved by some long term investors. It's also up 8.1% in about a month. But this could be related to good market conditions -- stocks in its market are up 3.9% in the last month. Anyone who held for that rewarding ride would probably be keen to talk about it.
Since the long term performance has been good but there's been a recent pullback of 3.3%, let's check if the fundamentals match the share price.
See our latest analysis for Axcelis Technologies
To paraphrase Benjamin Graham: Over the short term the market is a voting machine, but over the long term it's a weighing machine. One flawed but reasonable way to assess how sentiment around a company has changed is to compare the earnings per share (EPS) with the share price.
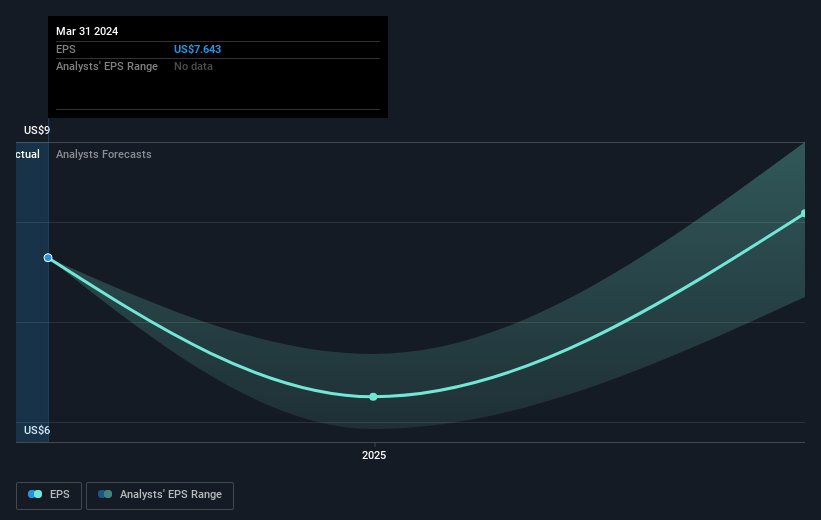
During five years of share price growth, Axcelis Technologies achieved compound earnings per share (EPS) growth of 46% per year. This EPS growth is reasonably close to the 50% average annual increase in the share price. Therefore one could conclude that sentiment towards the shares hasn't morphed very much. In fact, the share price seems to largely reflect the EPS growth.
You can see how EPS has changed over time in the image below (click on the chart to see the exact values).
We consider it positive that insiders have made significant purchases in the last year. Having said that, most people consider earnings and revenue growth trends to be a more meaningful guide to the business. It might be well worthwhile taking a look at our free report on Axcelis Technologies' earnings, revenue and cash flow.
A Different Perspective
Axcelis Technologies shareholders are down 31% for the year, but the market itself is up 28%. However, keep in mind that even the best stocks will sometimes underperform the market over a twelve month period. On the bright side, long term shareholders have made money, with a gain of 50% per year over half a decade. It could be that the recent sell-off is an opportunity, so it may be worth checking the fundamental data for signs of a long term growth trend. I find it very interesting to look at share price over the long term as a proxy for business performance. But to truly gain insight, we need to consider other information, too. To that end, you should be aware of the 1 warning sign we've spotted with Axcelis Technologies .
Axcelis Technologies is not the only stock insiders are buying. So take a peek at this free list of small cap companies at attractive valuations which insiders have been buying.
Please note, the market returns quoted in this article reflect the market weighted average returns of stocks that currently trade on American exchanges.
Have feedback on this article? Concerned about the content? Get in touch with us directly. Alternatively, email editorial-team (at) simplywallst.com.
This article by Simply Wall St is general in nature. We provide commentary based on historical data and analyst forecasts only using an unbiased methodology and our articles are not intended to be financial advice. It does not constitute a recommendation to buy or sell any stock, and does not take account of your objectives, or your financial situation. We aim to bring you long-term focused analysis driven by fundamental data. Note that our analysis may not factor in the latest price-sensitive company announcements or qualitative material. Simply Wall St has no position in any stocks mentioned.
