
 Yahoo Finance
 Is Aveo Group’s (ASX:AOG) Balance Sheet Strong Enough To Weather A Storm?

Investors are always looking for growth in small-cap stocks like Aveo Group (ASX:AOG), with a market cap of AU$1.19b. However, an important fact which most ignore is: how financially healthy is the business? Evaluating financial health as part of your investment thesis is essential, as mismanagement of capital can lead to bankruptcies, which occur at a higher rate for small-caps. Here are few basic financial health checks you should consider before taking the plunge. However, I know these factors are very high-level, so I recommend you dig deeper yourself into AOG here.
How much cash does AOG generate through its operations?
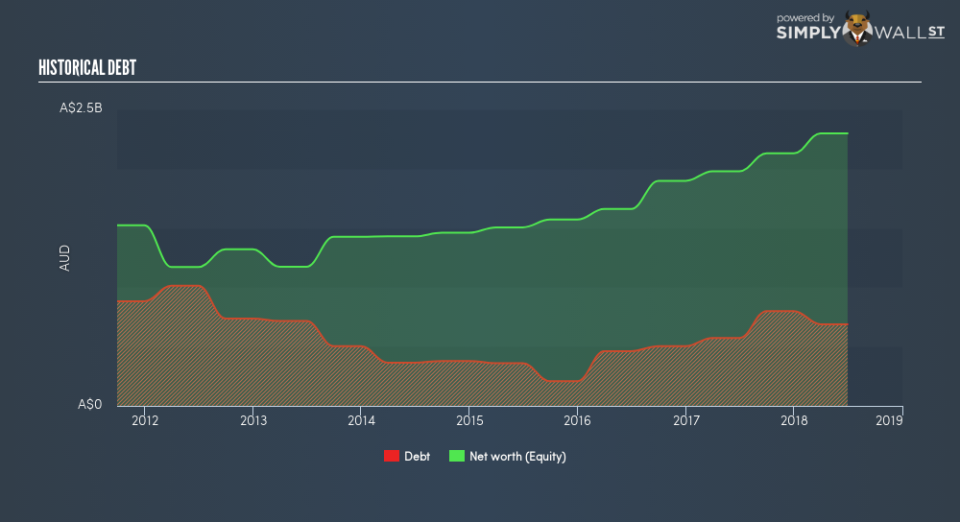
AOG’s debt levels surged from AU$573.1m to AU$687.7m over the last 12 months – this includes both the current and long-term debt. With this growth in debt, the current cash and short-term investment levels stands at AU$71.0m for investing into the business. On top of this, AOG has generated AU$102.8m in operating cash flow over the same time period, resulting in an operating cash to total debt ratio of 14.9%, meaning that AOG’s current level of operating cash is not high enough to cover debt. This ratio can also be a sign of operational efficiency as an alternative to return on assets. In AOG’s case, it is able to generate 0.15x cash from its debt capital.
Does AOG’s liquid assets cover its short-term commitments?
With current liabilities at AU$371.7m, it appears that the company has maintained a safe level of current assets to meet its obligations, with the current ratio last standing at 1.11x. Generally, for Real Estate companies, this is a reasonable ratio since there is a bit of a cash buffer without leaving too much capital in a low-return environment.
Does AOG face the risk of succumbing to its debt-load?
With a debt-to-equity ratio of 29.9%, AOG’s debt level may be seen as prudent. AOG is not taking on too much debt commitment, which may be constraining for future growth. We can check to see whether AOG is able to meet its debt obligations by looking at the net interest coverage ratio. A company generating earnings before interest and tax (EBIT) at least three times its net interest payments is considered financially sound. In AOG’s, case, the ratio of 40.46x suggests that interest is comfortably covered, which means that lenders may be inclined to lend more money to the company, as it is seen as safe in terms of payback.
Next Steps:
AOG’s low debt is also met with low coverage. This indicates room for improvement as its cash flow covers less than a quarter of its borrowings, which means its operating efficiency could be better. However, the company will be able to pay all of its upcoming liabilities from its current short-term assets. I admit this is a fairly basic analysis for AOG’s financial health. Other important fundamentals need to be considered alongside. I recommend you continue to research Aveo Group to get a more holistic view of the stock by looking at:
Future Outlook: What are well-informed industry analysts predicting for AOG’s future growth? Take a look at our free research report of analyst consensus for AOG’s outlook.
Valuation: What is AOG worth today? Is the stock undervalued, even when its growth outlook is factored into its intrinsic value? The intrinsic value infographic in our free research report helps visualize whether AOG is currently mispriced by the market.
Other High-Performing Stocks: Are there other stocks that provide better prospects with proven track records? Explore our free list of these great stocks here.
To help readers see past the short term volatility of the financial market, we aim to bring you a long-term focused research analysis purely driven by fundamental data. Note that our analysis does not factor in the latest price-sensitive company announcements.
The author is an independent contributor and at the time of publication had no position in the stocks mentioned. For errors that warrant correction please contact the editor at editorial-team@simplywallst.com.
