
 Yahoo Finance
 Australia and New Zealand Banking Group (ASX:ANZ) shareholders have earned a 53% return over the last year
Passive investing in index funds can generate returns that roughly match the overall market. But one can do better than that by picking better than average stocks (as part of a diversified portfolio). For example, the Australia and New Zealand Banking Group Limited (ASX:ANZ) share price is up 46% in the last 1 year, clearly besting the market return of around 22% (not including dividends). If it can keep that out-performance up over the long term, investors will do very well! However, the longer term returns haven't been so impressive, with the stock up just 5.3% in the last three years.
So let's investigate and see if the longer term performance of the company has been in line with the underlying business' progress.
See our latest analysis for Australia and New Zealand Banking Group
In his essay The Superinvestors of Graham-and-Doddsville Warren Buffett described how share prices do not always rationally reflect the value of a business. One imperfect but simple way to consider how the market perception of a company has shifted is to compare the change in the earnings per share (EPS) with the share price movement.
During the last year Australia and New Zealand Banking Group grew its earnings per share (EPS) by 68%. This EPS growth is significantly higher than the 46% increase in the share price. So it seems like the market has cooled on Australia and New Zealand Banking Group, despite the growth. Interesting.
The graphic below depicts how EPS has changed over time (unveil the exact values by clicking on the image).
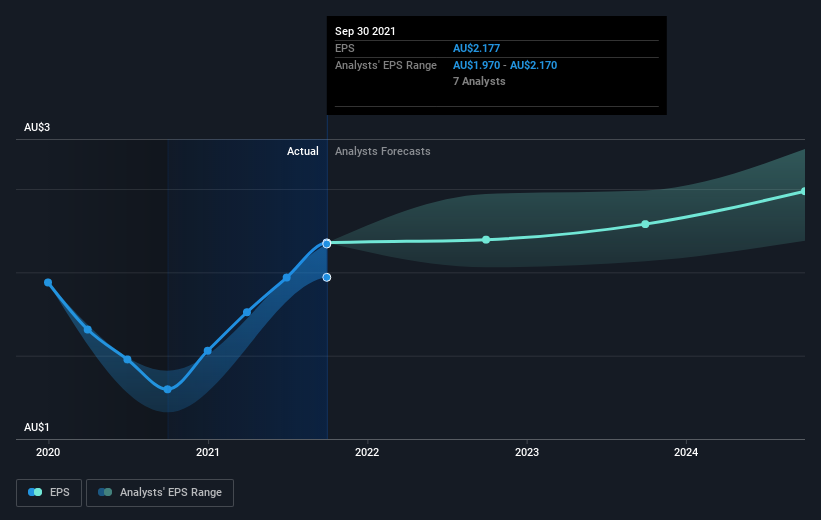
We know that Australia and New Zealand Banking Group has improved its bottom line lately, but is it going to grow revenue? You could check out this free report showing analyst revenue forecasts.
What About Dividends?
As well as measuring the share price return, investors should also consider the total shareholder return (TSR). Whereas the share price return only reflects the change in the share price, the TSR includes the value of dividends (assuming they were reinvested) and the benefit of any discounted capital raising or spin-off. It's fair to say that the TSR gives a more complete picture for stocks that pay a dividend. In the case of Australia and New Zealand Banking Group, it has a TSR of 53% for the last 1 year. That exceeds its share price return that we previously mentioned. This is largely a result of its dividend payments!
A Different Perspective
It's good to see that Australia and New Zealand Banking Group has rewarded shareholders with a total shareholder return of 53% in the last twelve months. That's including the dividend. Since the one-year TSR is better than the five-year TSR (the latter coming in at 6% per year), it would seem that the stock's performance has improved in recent times. Someone with an optimistic perspective could view the recent improvement in TSR as indicating that the business itself is getting better with time. I find it very interesting to look at share price over the long term as a proxy for business performance. But to truly gain insight, we need to consider other information, too. For example, we've discovered 2 warning signs for Australia and New Zealand Banking Group (1 is a bit unpleasant!) that you should be aware of before investing here.
Of course Australia and New Zealand Banking Group may not be the best stock to buy. So you may wish to see this free collection of growth stocks.
Please note, the market returns quoted in this article reflect the market weighted average returns of stocks that currently trade on AU exchanges.
This article by Simply Wall St is general in nature. We provide commentary based on historical data and analyst forecasts only using an unbiased methodology and our articles are not intended to be financial advice. It does not constitute a recommendation to buy or sell any stock, and does not take account of your objectives, or your financial situation. We aim to bring you long-term focused analysis driven by fundamental data. Note that our analysis may not factor in the latest price-sensitive company announcements or qualitative material. Simply Wall St has no position in any stocks mentioned.
Have feedback on this article? Concerned about the content? Get in touch with us directly. Alternatively, email editorial-team (at) simplywallst.com.
