
 Yahoo Finance
 Aurizon Holdings Limited (ASX:AZJ): Time For A Financial Health Check

Small-caps and large-caps are wildly popular among investors; however, mid-cap stocks, such as Aurizon Holdings Limited (ASX:AZJ) with a market-capitalization of AU$8.84b, rarely draw their attention. Despite this, the two other categories have lagged behind the risk-adjusted returns of commonly ignored mid-cap stocks. AZJ’s financial liquidity and debt position will be analysed in this article, to get an idea of whether the company can fund opportunities for strategic growth and maintain strength through economic downturns. Don’t forget that this is a general and concentrated examination of Aurizon Holdings’s financial health, so you should conduct further analysis into AZJ here. View out our latest analysis for Aurizon Holdings
How much cash does AZJ generate through its operations?
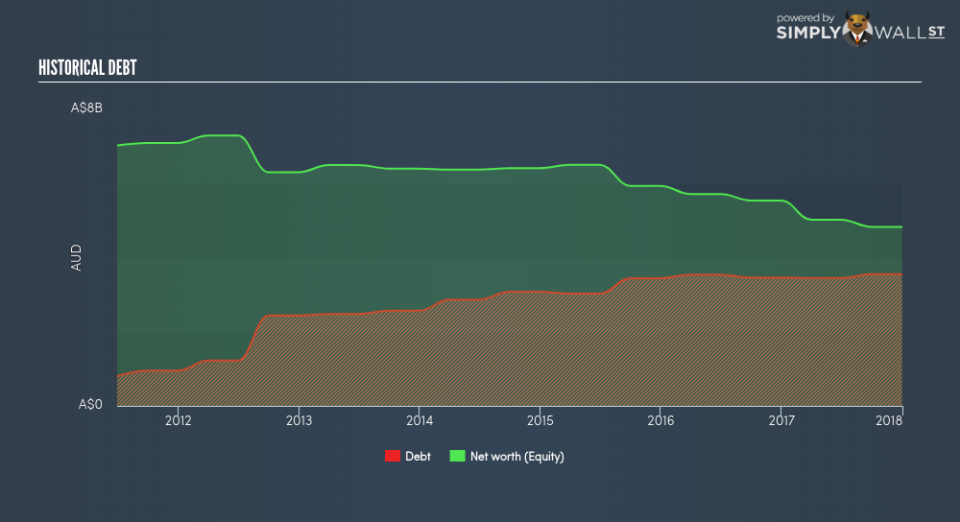
AZJ’s debt level has been constant at around AU$3.45b over the previous year made up of current and long term debt. At this stable level of debt, the current cash and short-term investment levels stands at AU$88.70m for investing into the business. On top of this, AZJ has generated AU$1.24b in operating cash flow in the last twelve months, resulting in an operating cash to total debt ratio of 35.93%, indicating that AZJ’s operating cash is sufficient to cover its debt. This ratio can also be a sign of operational efficiency for unprofitable companies since metrics such as return on asset (ROA) requires a positive net income. In AZJ’s case, it is able to generate 0.36x cash from its debt capital.
Does AZJ’s liquid assets cover its short-term commitments?
With current liabilities at AU$744.20m, it appears that the company has not maintained a sufficient level of current assets to meet its obligations, with the current ratio last standing at 0.98x, which is below the prudent industry ratio of 3x.
Can AZJ service its debt comfortably?
AZJ is a relatively highly levered company with a debt-to-equity of 73.57%. This is not unusual for mid-caps as debt tends to be a cheaper and faster source of funding for some businesses. However, since AZJ is currently loss-making, there’s a question of sustainability of its current operations. Running high debt, while not yet making money, can be risky in unexpected downturns as liquidity may dry up, making it hard to operate.
Next Steps:
AZJ’s high cash coverage means that, although its debt levels are high, the company is able to utilise its borrowings efficiently in order to generate cash flow. However, its lack of liquidity raises questions over current asset management practices for the mid-cap. This is only a rough assessment of financial health, and I’m sure AZJ has company-specific issues impacting its capital structure decisions. I recommend you continue to research Aurizon Holdings to get a more holistic view of the stock by looking at:
Future Outlook: What are well-informed industry analysts predicting for AZJ’s future growth? Take a look at our free research report of analyst consensus for AZJ’s outlook.
Valuation: What is AZJ worth today? Is the stock undervalued, even when its growth outlook is factored into its intrinsic value? The intrinsic value infographic in our free research report helps visualize whether AZJ is currently mispriced by the market.
Other High-Performing Stocks: Are there other stocks that provide better prospects with proven track records? Explore our free list of these great stocks here.
To help readers see pass the short term volatility of the financial market, we aim to bring you a long-term focused research analysis purely driven by fundamental data. Note that our analysis does not factor in the latest price sensitive company announcements.
The author is an independent contributor and at the time of publication had no position in the stocks mentioned.
