AUDNZD: testing the new resistance
The new week starts for us with an interesting trading opportunity on AUDNZD. This pair has recently been following the technical protocol with great accuracy, so it provides us with a very interesting occasion.
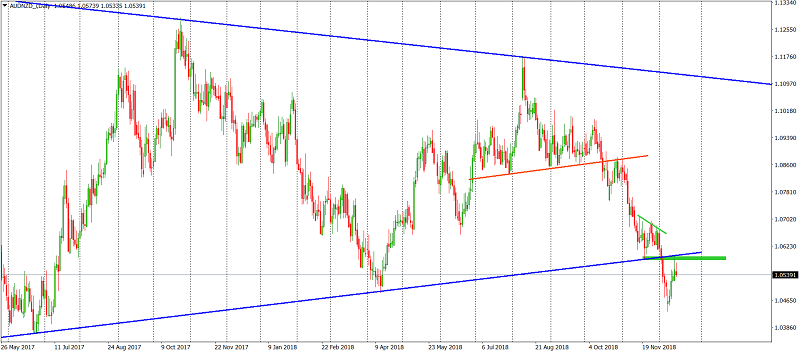
Price action principles have been dominant here over the past few months. It all started with the Head & Shoulders pattern during the summer. A proper decline started in October after the breakout of the neckline (red), which was then successfully tested as the closest resistance. November brought us a descending triangle pattern (green lines) in a place where this kind of pattern can be deadly. This place was the lower line of the giant symmetrical triangle (lower blue). The reason that this can be deadly is that this kind of formation shows an accumulation of bearish power and suggests that there could be a breakout to the downside. If we combine this with the symmetrical triangle, it tends to be huge. The price indeed went lower but has recovered slightly over the last few days.

That reversal is a normal bit of price action and can be used as a great opportunity to open short positions at better, i.e. higher prices. As long as we stay below the green area, the sentiment is negative. Our view is additionally strengthened by the fact that the last two daily candlesticks on the chart have long wicks, which indicate a rejection of the higher prices. At the end of the day, sellers would be more than happy to see a shooting star formation.
This article is written by Tomasz Wisniewski, a senior analyst at Alpari Research & Analysis
This article was originally posted on FX Empire

 Yahoo Finance