
 Yahoo Finance
 AUD/USD, NZD/USD, USD/CNY – Daily Forecast
AUD/USD – Investors Eye Confidence Reports
There are no major events on Monday, but traders should keep an eye on two key confidence indicators which could impact on AUD/USD movement. NAB Business Confidence will be released on Tuesday, followed by Westpac Consumer Sentiment on Wednesday. As well, Chinese CPI, which will be published on Tuesday, could affect the pair.
There were plenty of Australian events last week, and the Aussie responded with sharp gains of 1.6%, its strongest weekly performance since last September. Key data was a mix, as GDP for Q2 posted a strong gain of 0.5%, while retail sales fell by 0.1%. As expected, the RBA held the benchmark rate at 1.0%. RBA Governor Philip Lowe said that it was reasonable to expect rates to stay at low levels, which means that the Australian dollar is unlikely to get any help from the RBA in the form of higher interest rates.
AUD/USD Technical Analysis
AUD/USD was marked by upward trends last week and this movement has continued in Monday’s Asian session. The pair is up 0.17% on Monday, after little movement on Friday.
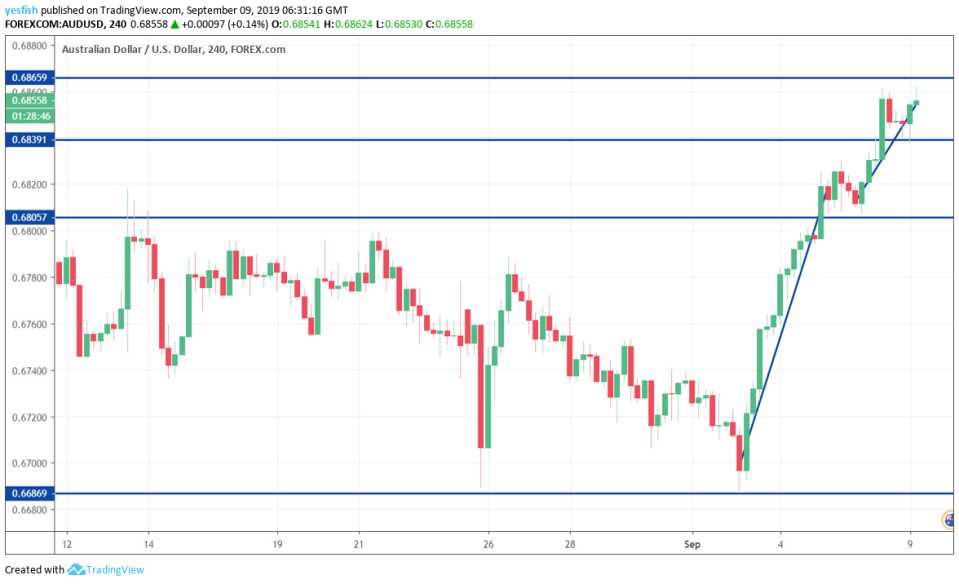
The Australian dollar has resistance at 0.6865 squarely in its sights, and I expect this line to fall early in the week. Next, there is a major resistance line at 0.6988.
On the downside, 0.6805 has been providing support last week. If the Aussie rally runs out of steam, this line will face pressure. This is followed by 0.6686, which is a major support level.
USD/CNY – Trade Surplus Slips
The new trading week has started with soft data, as China’s trade surplus fell to $34.8 billion in August, down from $45 billion a month earlier. On Tuesday, China releases CPI, which is projected to slow to 2.6% in August, after a gain of 2.8% in July.
The ongoing trade war between China and the U.S. has taken a toll on the Chinese economy, particularly on exports and the manufacturing sector. Still, August PMIs pointed upwards in August, as the Caixin manufacturing and services PMIs both improved. The services PMI rose to 52.1, up from 51.6 in July. This indicates slight expansion. The manufacturing PMI improved to 50.4, as it barely scraped into expansion territory. However, this was an improvement after back-to-back readings below 50, which indicates contraction.
USD/CNY Technical Analysis
After recording losses on Friday, USD/CNY has started the new trading week with slight gains. It’s too early to tell if this upward momentum will continue, or is it a retracement of Friday’s downward movement.
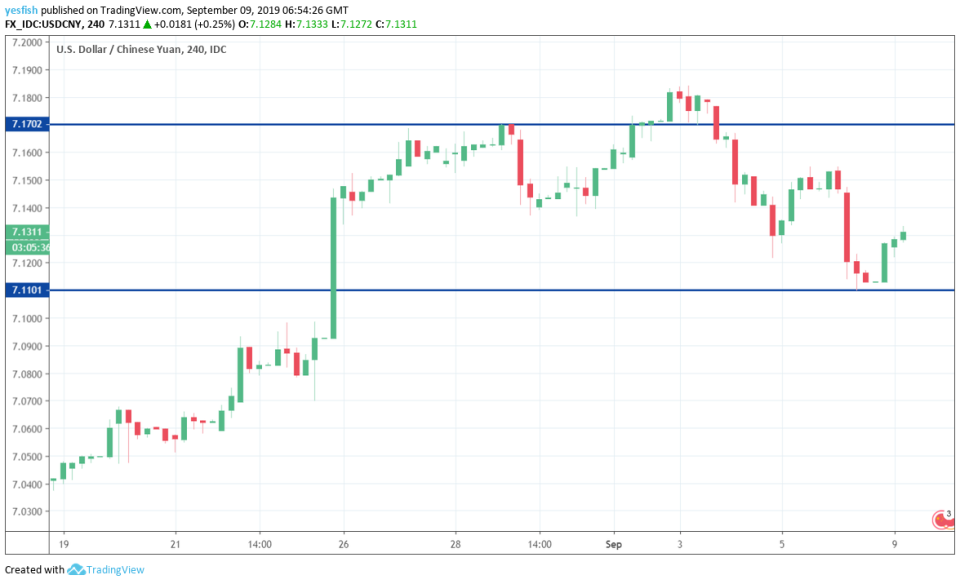
On the upside, there is resistance at 7.1702, which was an active line last week. There is immediate support at 7.1100. This line could be tested if the pair heads lower.
NZD/USD – Manufacturing Reports in Spotlight
The new trading week kicked off on a sour note, has manufacturing sales slipped 0.7% in the second quarter. This marks a second decline in the past three months, as the US-China trade war continues to take a toll on New Zealand’s manufacturing sector. On Thursday, we’ll get a look at the NZ Business Manufacturing Index. The indicator dropped to 48.2 in July, its first contraction since 2012. Another decline could raise concerns about the health of the manufacturing sector.
The New Zealand economy is very dependent on commodity exports, so fluctuations in commodity prices can have a significant impact on the movement of NZD/USD. The ANZ Commodity Price Index posted a modest gain of 0.3% in August, after recording two straight declines.
NZD/USD Technical Analysis
NZD/USD was marked by an upward trend line on Friday, but the pair has leveled out in Asian trade on Monday.
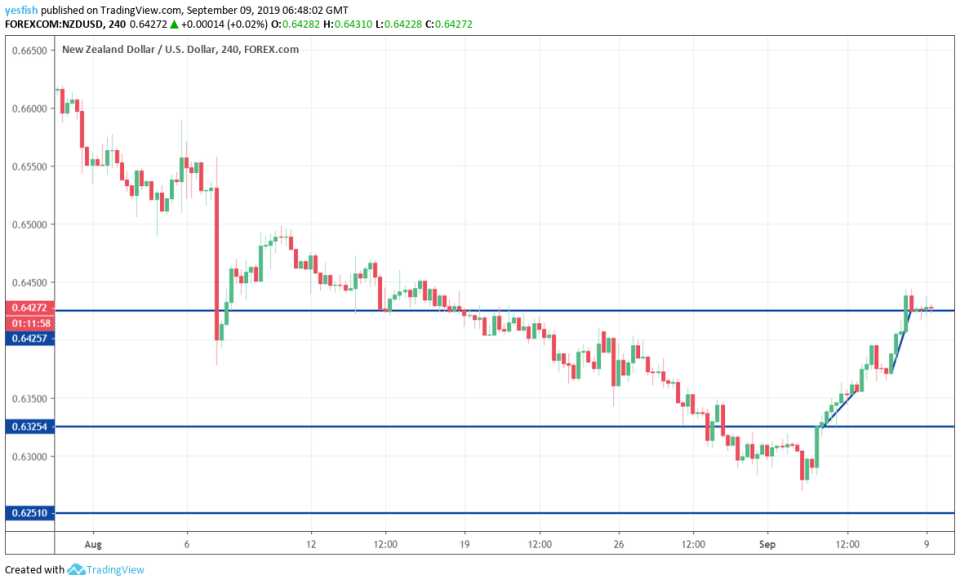
On the upside, 0.6425 is an important resistance line. This line was providing support up until mid-August but switched to a resistance role as NZD/USD lost ground.
There is support at 0.6235. This is followed by 0.6250, which is a major support level.
This article was originally posted on FX Empire
