
 Yahoo Finance
 AUD/USD Forex Technical Analysis – Are We Headed to Another Test of .7501?
Higher U.S. Treasury yields and expectations of rising rates later this year are weighing on the Australian Dollar. At the same time the Fed is considering as many as 2 more rate hikes this year, the Reserve Bank of Australia is likely to leave rates at historically low levels at this week’s monetary policy committee meeting.
Last week, the AUD/USD settled at .7669, down 0.0090 or -1.16%.
Despite rising commodity prices, the Aussie is likely to continue to succumb to the widening of the interest rate differential between U.S. Government Bonds and Australian Government Bonds. This is helping to make the U.S. Dollar a more attractive investment at this time.
Weekly Swing Chart Technical Analysis
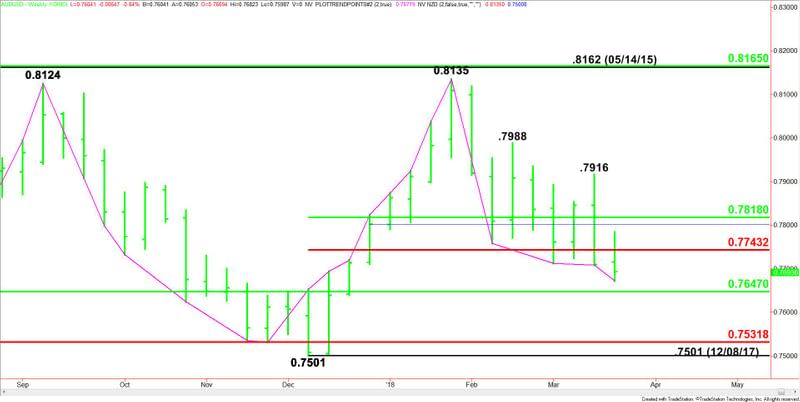
The main trend is up according to the weekly swing chart, but momentum has been trending lower since the main top at .8135 the week-ending January 26. Crossing to the weak side of a retracement zone is also contributing to the bearish sentiment and weak momentum.
The short-term range is .7501 to .8135. Its retracement zone is .7818 to .7743. After consolidating inside this zone for six weeks and attempting to breakout to the upside, the AUD/USD closed under this zone last week, indicating that sellers are taking control.
The long-term range was formed by the December 23, 2016 main bottom at .7159 and the January 26, 2018 main top at .8135. Its retracement zone at .7647 to .7532 is the primary downside target. The AUD/USD tested this zone for five weeks between the week-ending November 17 and the week-ending December 15.
The retracement zone at .7647 to .7532 is controlling the longer-term direction of the Australian Dollar. We could see a technical bounce on the first test of this area, but if it fails, look for a possible test of .7501. This is the trigger point for an even steeper decline with the next potential targets coming in at .7329 and .7159.
Weekly Swing Chart Technical Forecast
Based on last week’s close at .7669, and the price action the previous three weeks, the direction of the AUD/USD this week is likely to be determined by trader reaction to the short-term Fibonacci level at .7743.
A sustained move under .7743 will signal the presence of sellers. If this move generates enough downside momentum then look for the selling to extend into the major 50% level at .7647. We could see a technical bounce on the first test of this level, but if it fails then look for an acceleration to the downside with the next likely targets over the near-term, the major Fib level at .7532 and the December 2017 main bottom at .7501.
Overtaking and sustaining a rally over .7743 will indicate the presence of buyers. It will also be a sign that the sellers are lightening up their pressure. If this creates enough upside momentum then look for the market to eventually reach the 50% level at .7818. Sentiment could shift back to the upside if buyers can overcome this level.
This article was originally posted on FX Empire
More From FXEMPIRE:
Natural Gas Consolidates Despite Continue Inventory Withdrawals
AUD/USD Forex Technical Analysis – Are We Headed to Another Test of .7501?
Scalping, Swing and Long-Term Trading Strategies: A Complete Guide
U.S Dollar Strong as Treasury Yields Rise, Earnings Reports in Focus
E-mini Dow Jones Industrial Average (YM) Futures Analysis – April 23, 2018 Forecast
