
 Yahoo Finance
 AUD/USD Forex Technical Analysis – Needs to Hold Fibonacci Level at .7825 to Sustain Upside Momentum
The Australian Dollar finished higher on Friday with surging commodity prices and a drop in U.S. Treasury yields driving the buying spree. With the Aussie testing its highest level since February 26, bullish traders are hoping the strong upside momentum carries over into Monday’s trade.
On Friday, the AUD/USD settled at .7844, up 0.0058 or +0.75%.
Early in the session, the Aussie was supported by a strong rally in the prices of Australia’s top export earner, iron ore. Futures of the key steel making ingredient vaulted to a record high on Friday pushing spot prices to the highest-even above $200 a tonne.
The AUD/USD was driven higher later in the session after a steep drop in yields following a weaker-than-expected U.S. Non-Farm Payrolls report.
After the initial plunge, yields bounced back as the market digested the data and came to the conclusion that the jobs report miss wasn’t as bad as originally thought. If this line of thought continues, then yields could rebound on Monday and the Aussie could feel some pressure.
Daily Swing Chart Technical Analysis
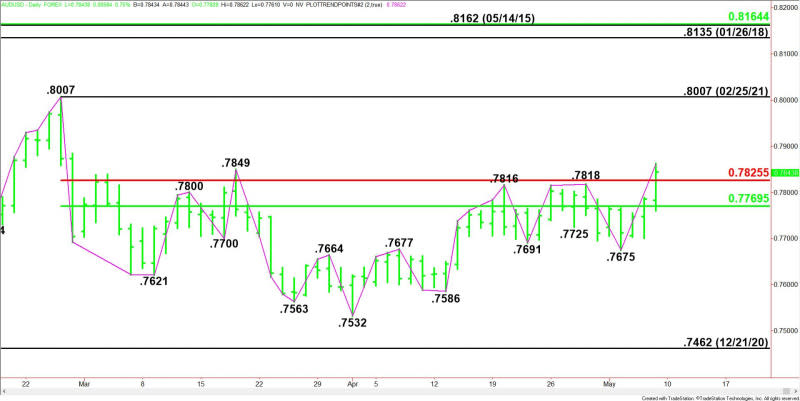
The main trend is up according to the daily swing chart. The uptrend changed to up on Friday when buyers took out .7818 and was reaffirmed when buyers took out the March 18 main top at .7849. The main trend will change to down on a move through .7675.
The main range is .8007 to .7532. The AUD/USD settled on the strong side of its retracement zone at .7825 to .7769, making it new support.
Short-Term Outlook
Holding above the main Fibonacci level at .7826 will indicate the presence of buyers. Taking out last week’s high at .7862 will indicate the buying is getting stronger.
The daily chart indicates there is plenty of room to the upside over .7862 with the February 25 main top at .8007 the primary upside target.
A break under .7825 will be the first sign of weakness. If this move creates enough downside momentum then look for the selling to possibly extend into the main 50% level at .7769.
For a look at all of today’s economic events, check out our economic calendar.
This article was originally posted on FX Empire
